§ Port Intelligence
Know the port before your client asks.
Historical weather patterns, sea conditions, air quality, and crowding data for every cruise port - plus 3D port maps built from OpenStreetMap buildings. Know whether a port will be swamped in July or calm in September.
Start 14-day trial1,732 ports · 377,340 scheduled port calls
cruisingintelligence.com / app / ports
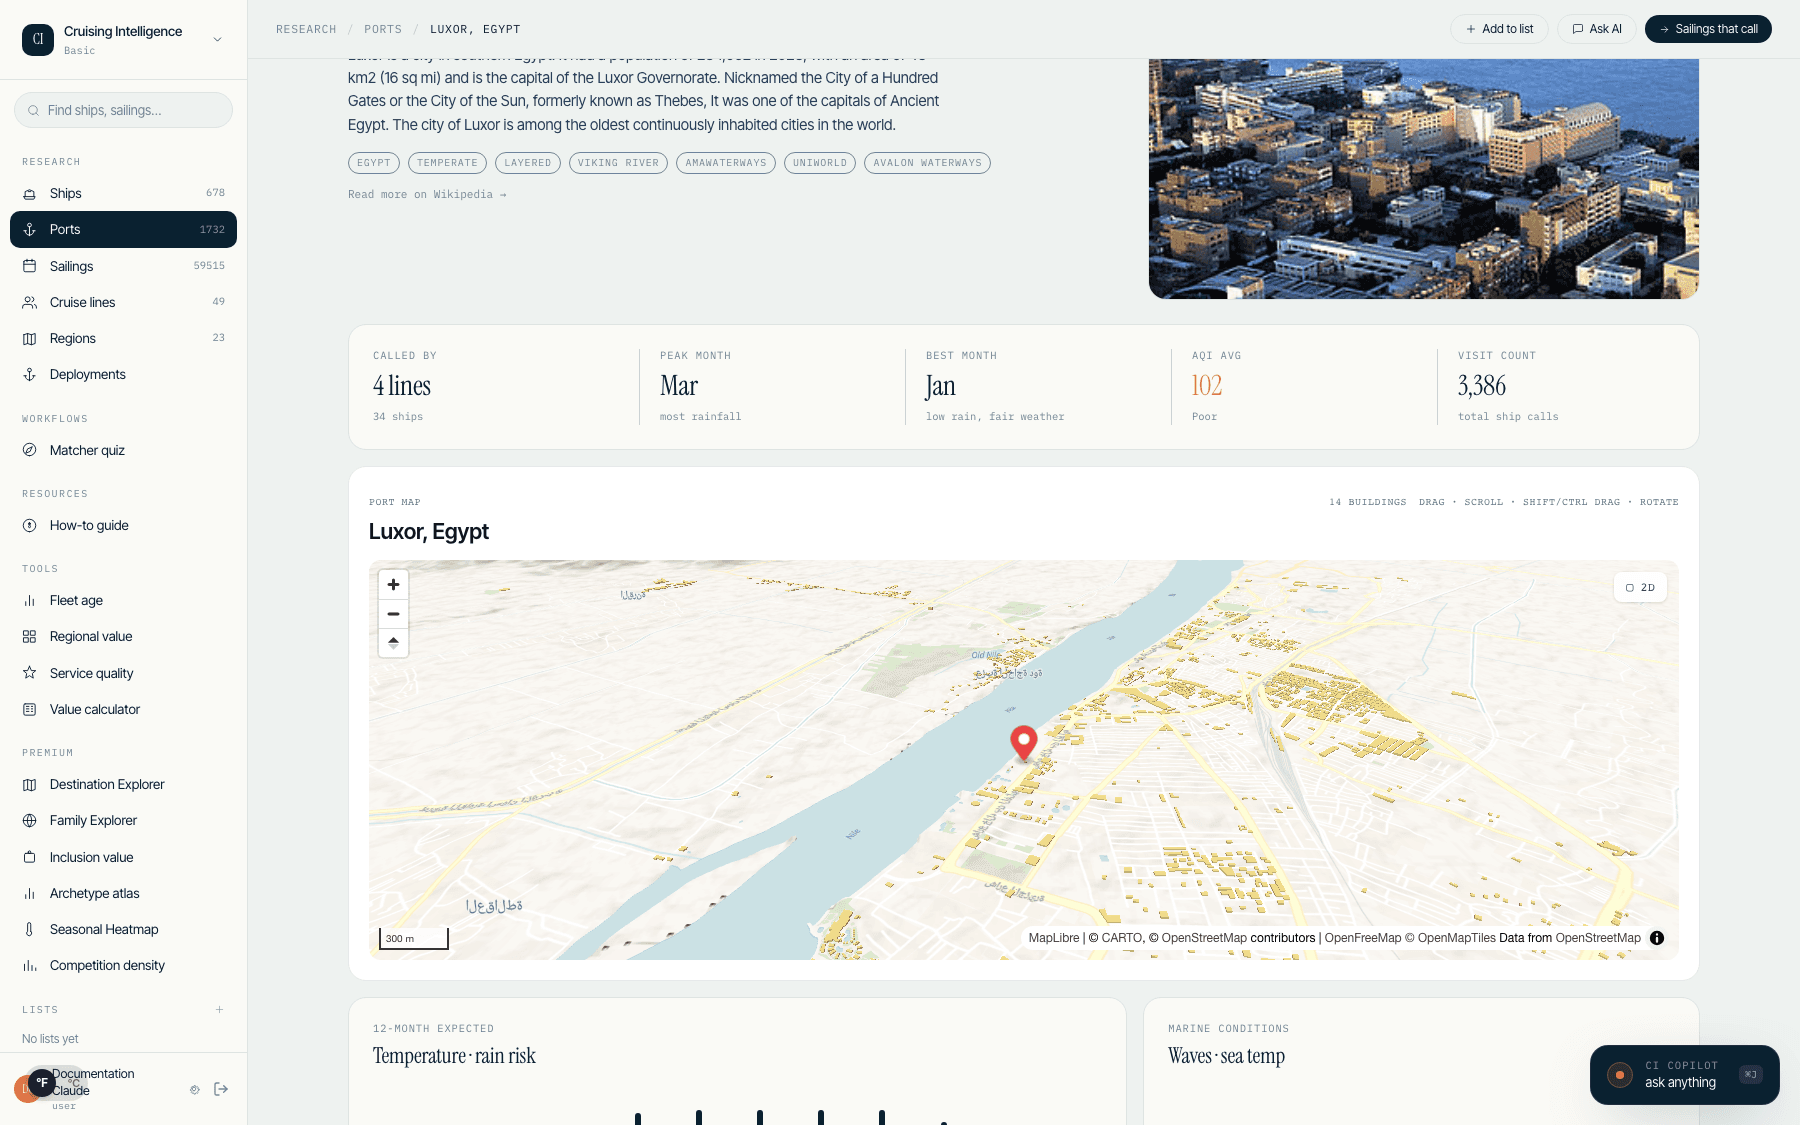
What every port page covers.
Historical weather patterns by month - temperature, rain, and wind - turn "when should we go?" into a data answer instead of a shrug. Sea conditions tell you how the water actually behaves around the port, month by month, for clients who worry about motion.
Air quality history (AQI) flags ports where sensitive travelers should plan their days ashore carefully. Crowding data shows how many ships and guests a port absorbs in a given month - the difference between a quiet tender dock and four ships in port at once.
Every port also gets a 3D map with OpenStreetMap buildings extruded around the dock - the town your client will actually walk into, not just a pin on a chart.
Five signals per port.
Weather patterns
Monthly historical normals - temperature, rain, wind - for every port.
Sea conditions
How calm the water tends to be, month by month, for motion-sensitive clients.
Air quality
AQI history so you can flag concerns before the client reads the news first.
Crowding
Ship traffic by month - know whether a port will be swamped in July or calm in September.
3D port maps
OpenStreetMap buildings extruded around the dock. The town, not just the pier.