Who sails where, every season.
A 49 × 21 matrix showing exactly which ships sail which regions, filtered by season and tier. The fastest way to answer "who sails to Alaska in 2027?"
Start 14-day trial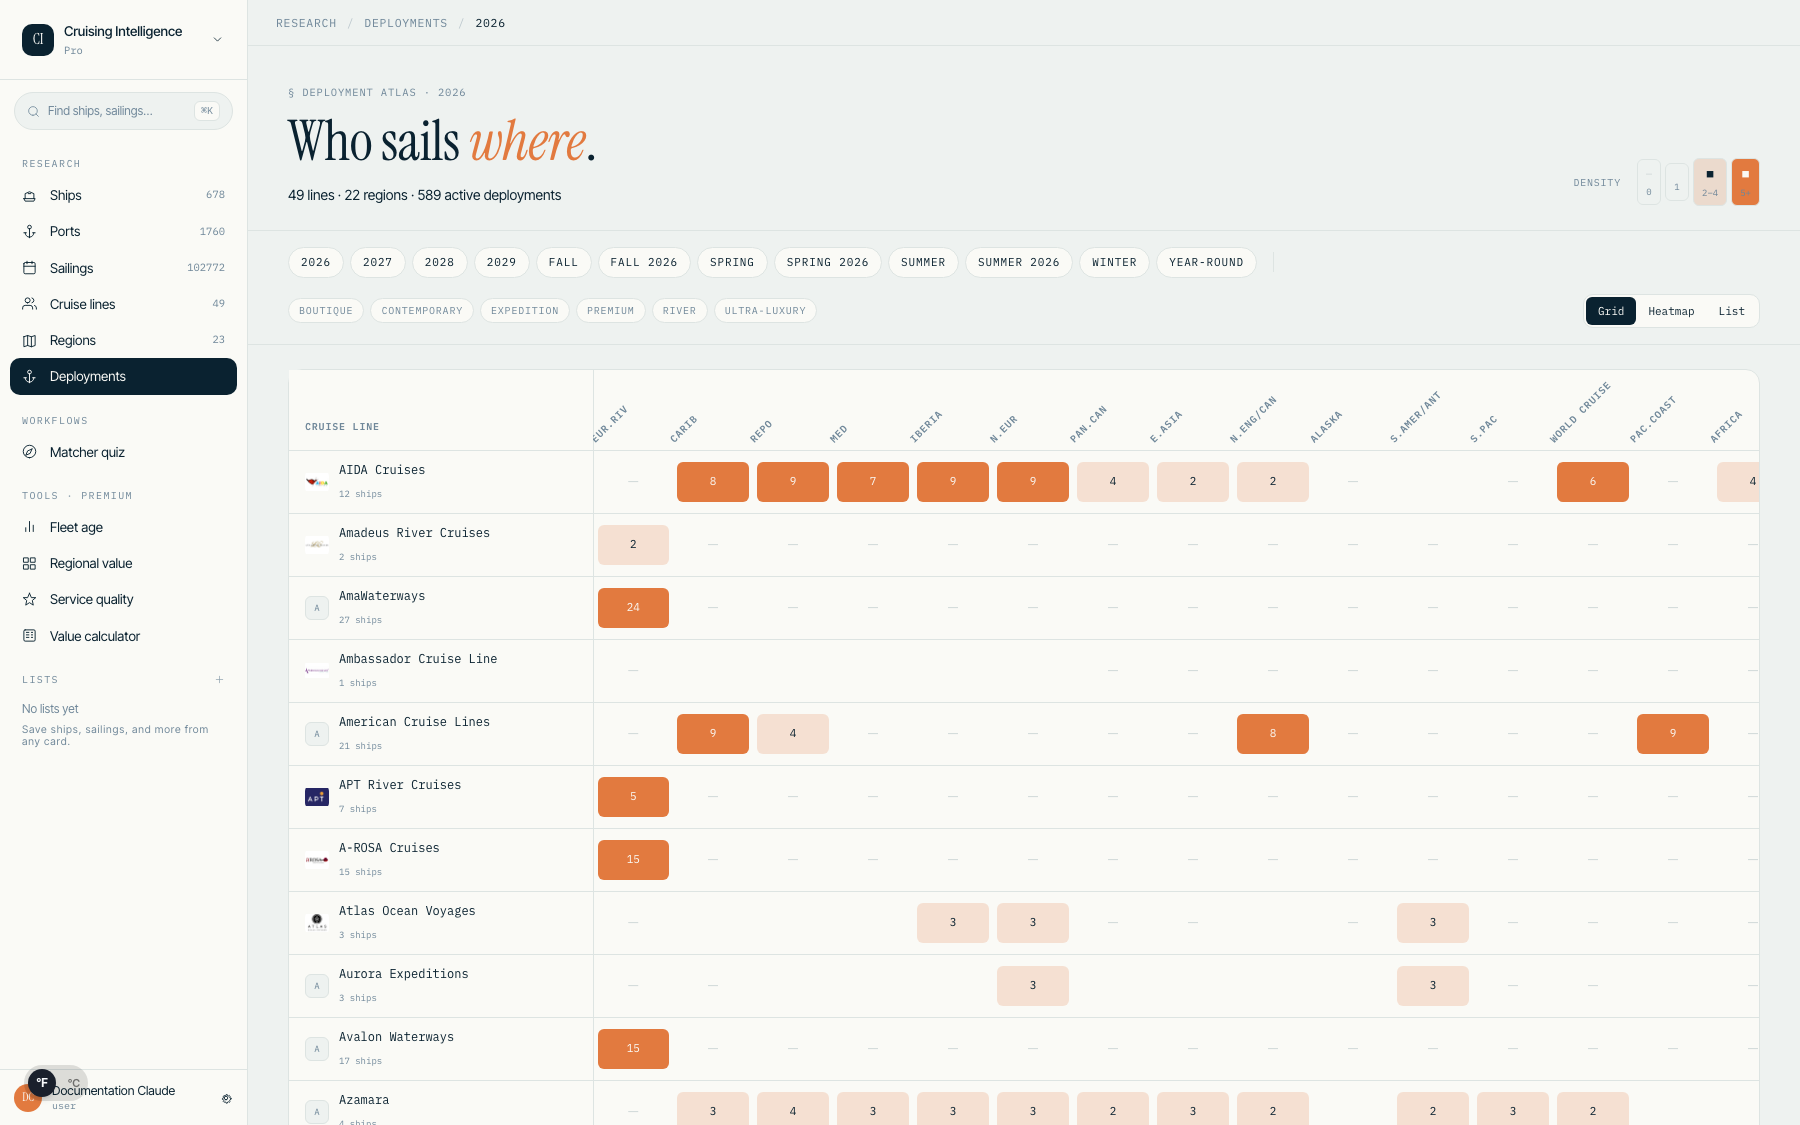
The matrix advisors actually need.
Cruise line deployment data is scattered across press releases, deck-plan PDFs, and booking systems that were never designed for research. The Deployment Grid consolidates it into a single view: cruise lines on one axis, regions on the other, with season as the filter.
Click any cell to see the exact ships deployed. Click a region total to see every line that sails there. Filter by season (Summer 2026, Winter 2027) and by tier (Contemporary, Premium, Ultra-Luxury) to narrow the field.
A month-by-region calendar view shows scheduled sailings by month across all 49 lines - useful for spotting shoulder-season gaps or identifying which lines commit the most capacity to a region.