Platform Guide
Research any cruise in seconds, not hours. Learn how to use every feature of Cruising Intelligence.
1.Getting Started
Who Can Use Cruising Intelligence?
Cruising Intelligence is exclusively for travel professionals with a valid IATA number or CLIA number (personal or agency-affiliated). This keeps professional research tools in the hands of agents, protecting your business from consumers booking direct.
Creating Your Account
Visit cruisingintelligence.com and click Start 14-Day Free Trial. Enter your email, password, and IATA or CLIA number. Your account is created immediately with full platform access.
Your Free Trial
Your 14-day trial includes:
- •Full access to all platform tools and data
- •10 AI Chat queries to explore the assistant
- •No credit card required
Logging In
After creating your account, log in at any time from the top-right corner of any page.
2.Your Dashboard
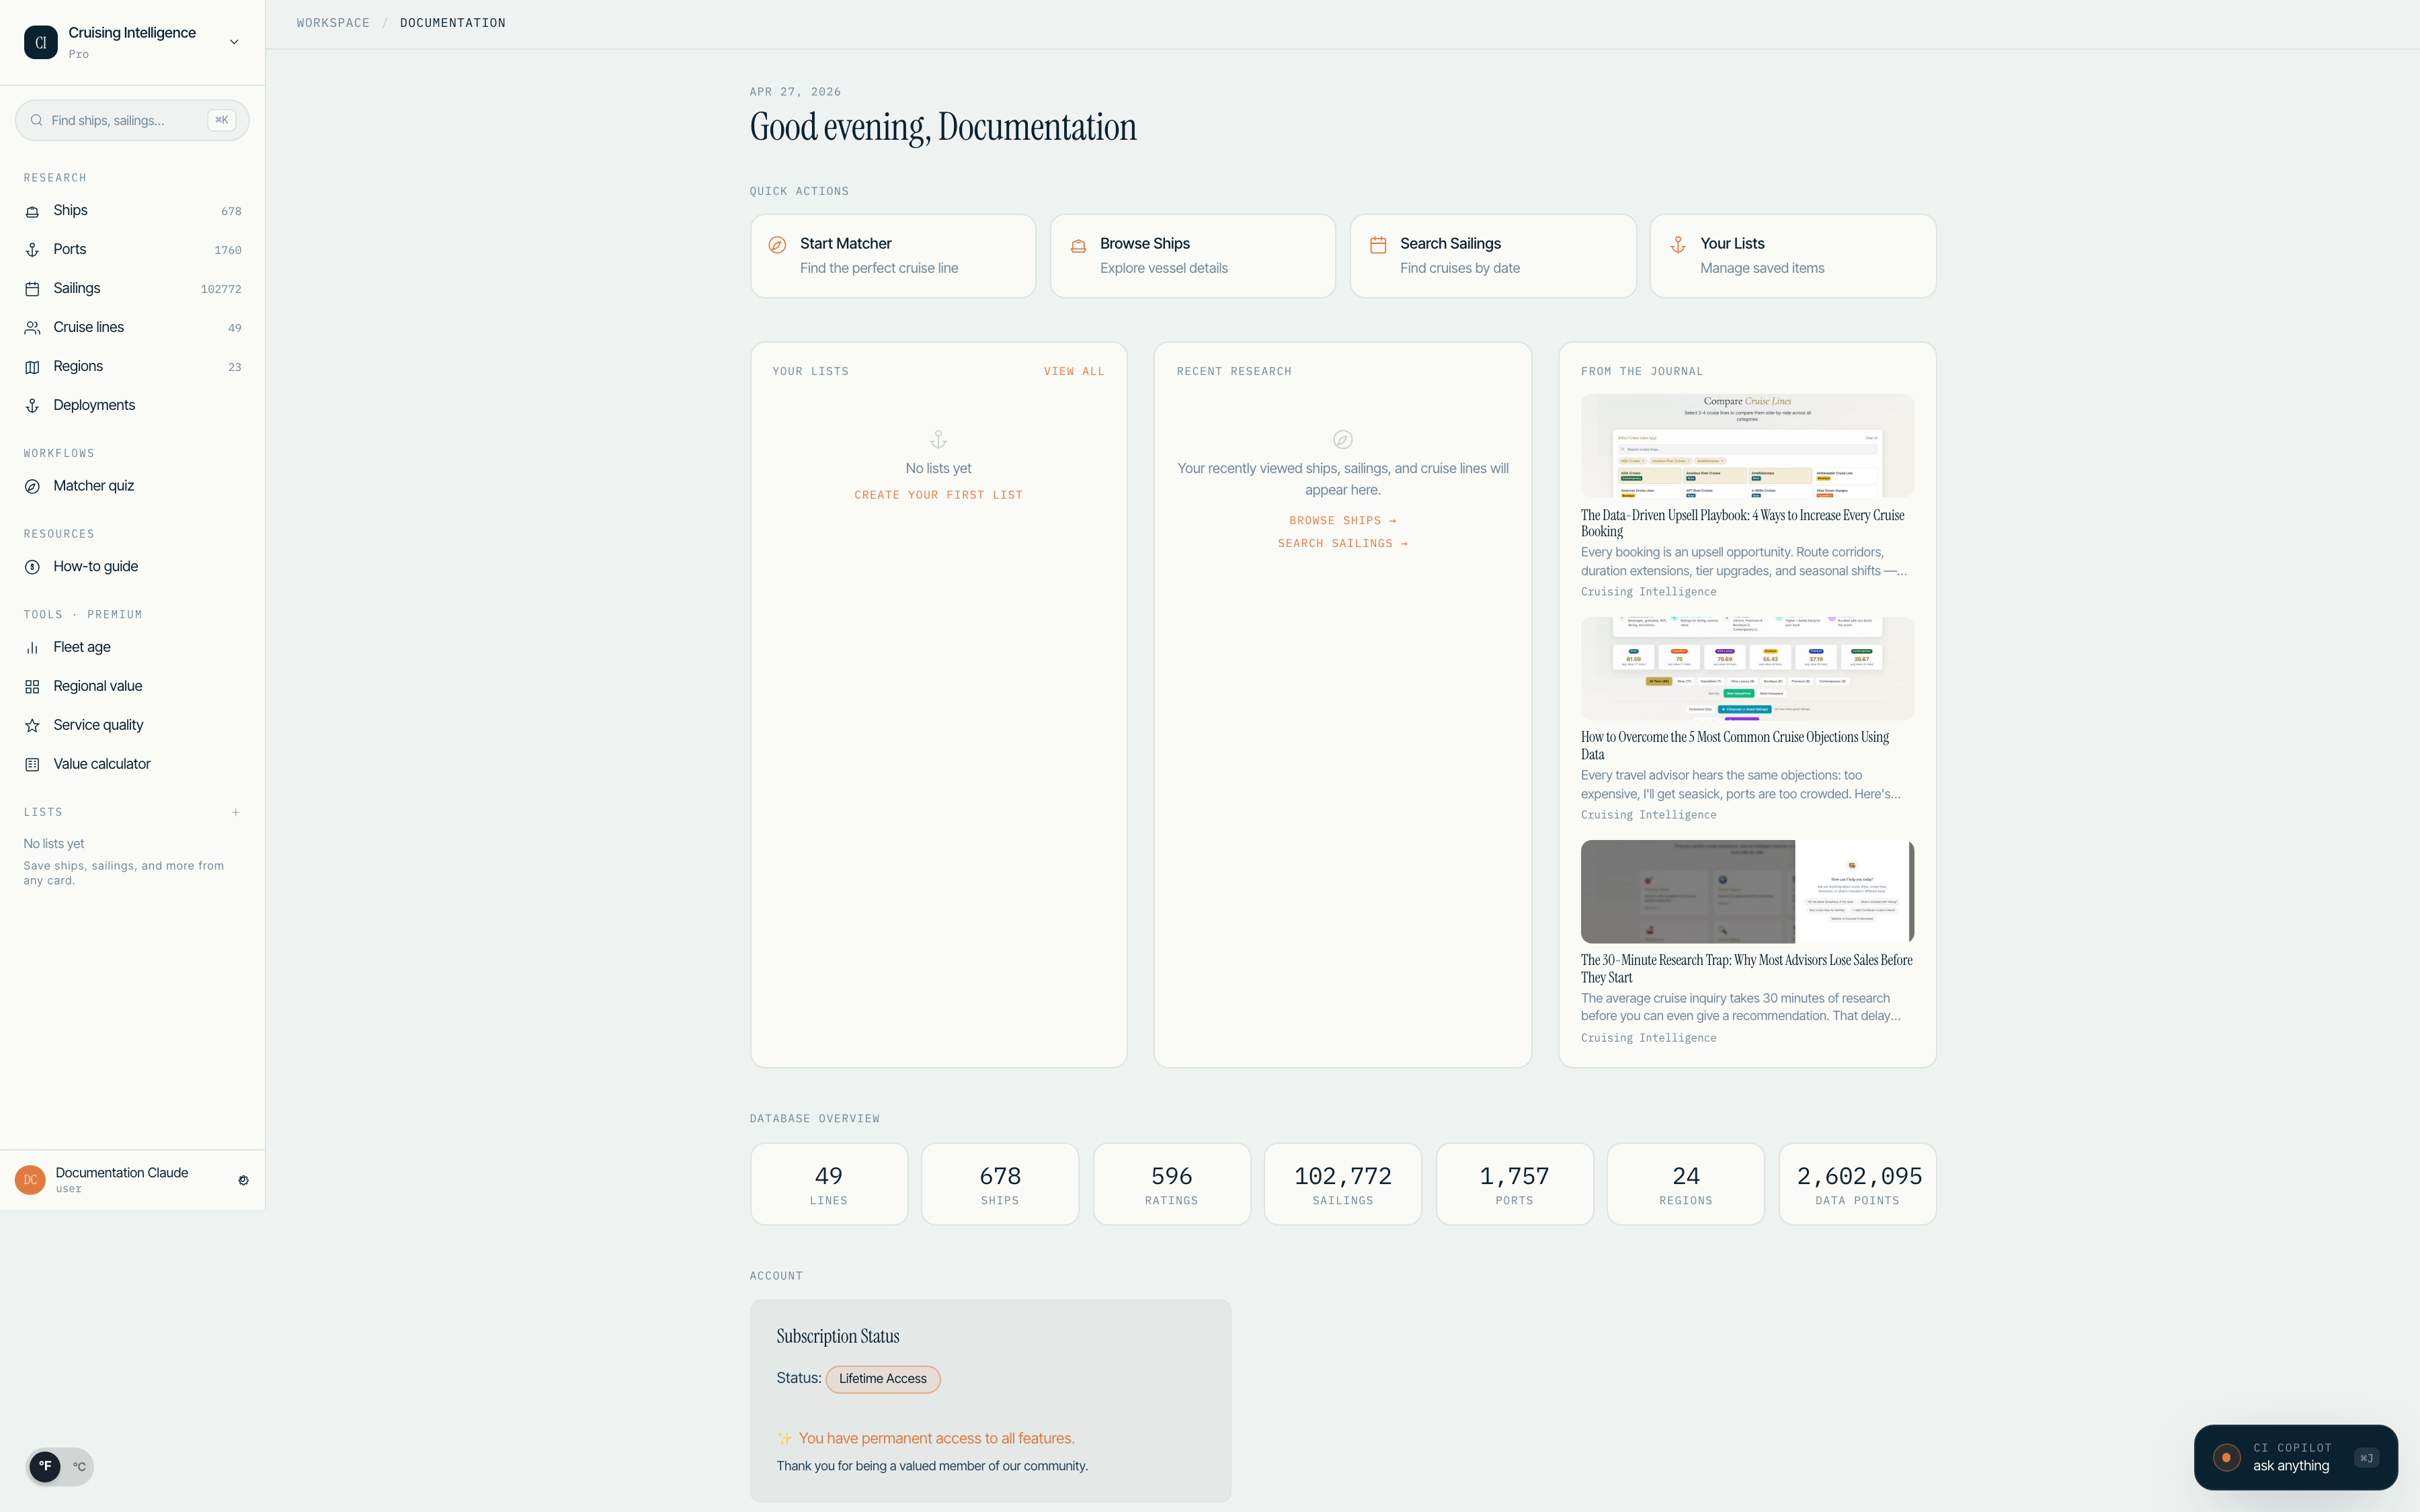
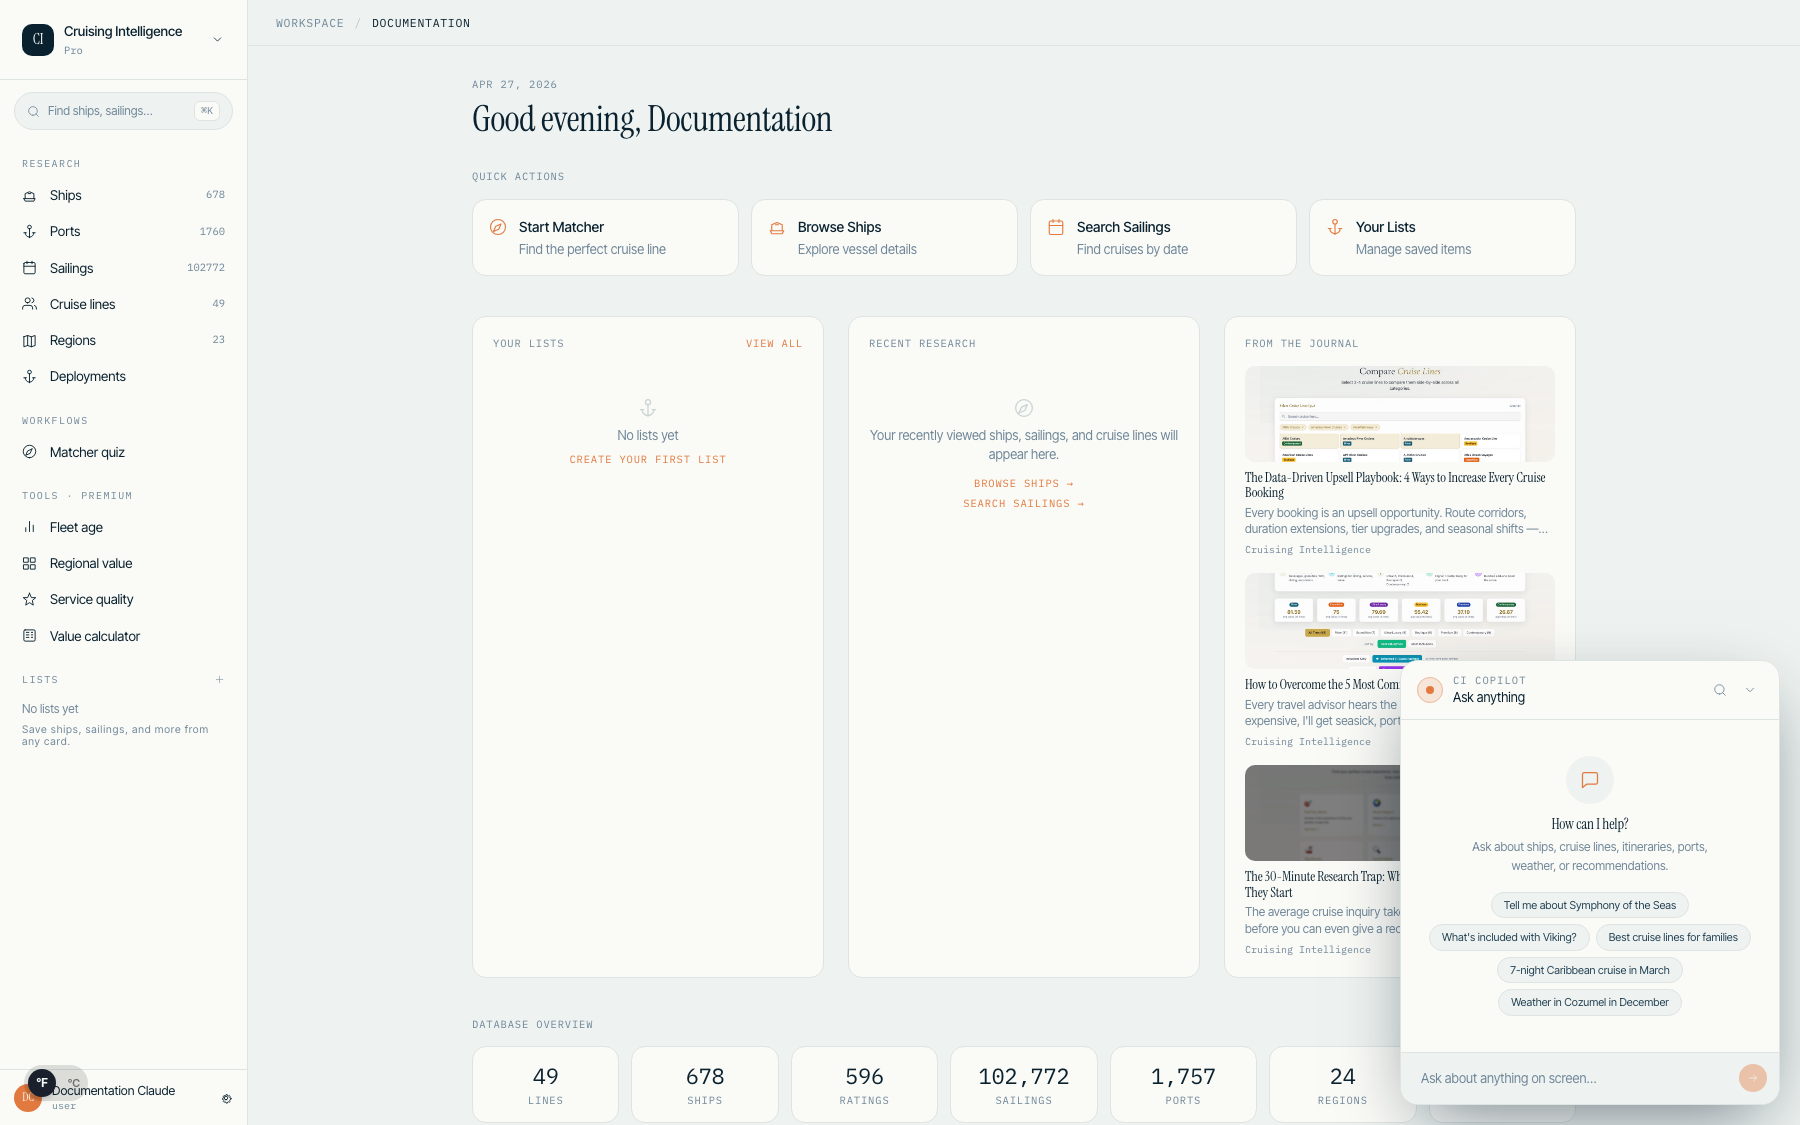
After logging in, your Harbor dashboard provides a quick overview of your practice and the platform.
Dashboard Layout
The dashboard is organized into three columns:
- •Pinned Lists — Quick access to saved ship and sailing lists you have created
- •Recent Research — Ships, sailings, and cruise lines you have viewed recently
- •Editorial Strip — Latest blog posts, platform updates, and curated insights
Deployment Snapshot
Below the three-column grid, a Deployment Snapshot shows which ships are sailing in the current season across the top regions. This is a quick way to spot availability and new deployments without opening the full Deployment Grid.

Pin your most-used lists to keep them at the top of the dashboard. Lists are great for organizing options per client or trip.
3.Ship Browser
The Ship Browser lets you explore every active cruise ship with detailed specifications, dining venues, bars, cabin categories, and unique features.
Browsing Ships
Navigate to Ships from the left rail or top nav. Ships are displayed in a card grid showing the ship image, name, cruise line, key specs, and rating. Toggle between grid and list views using the icon in the results header.
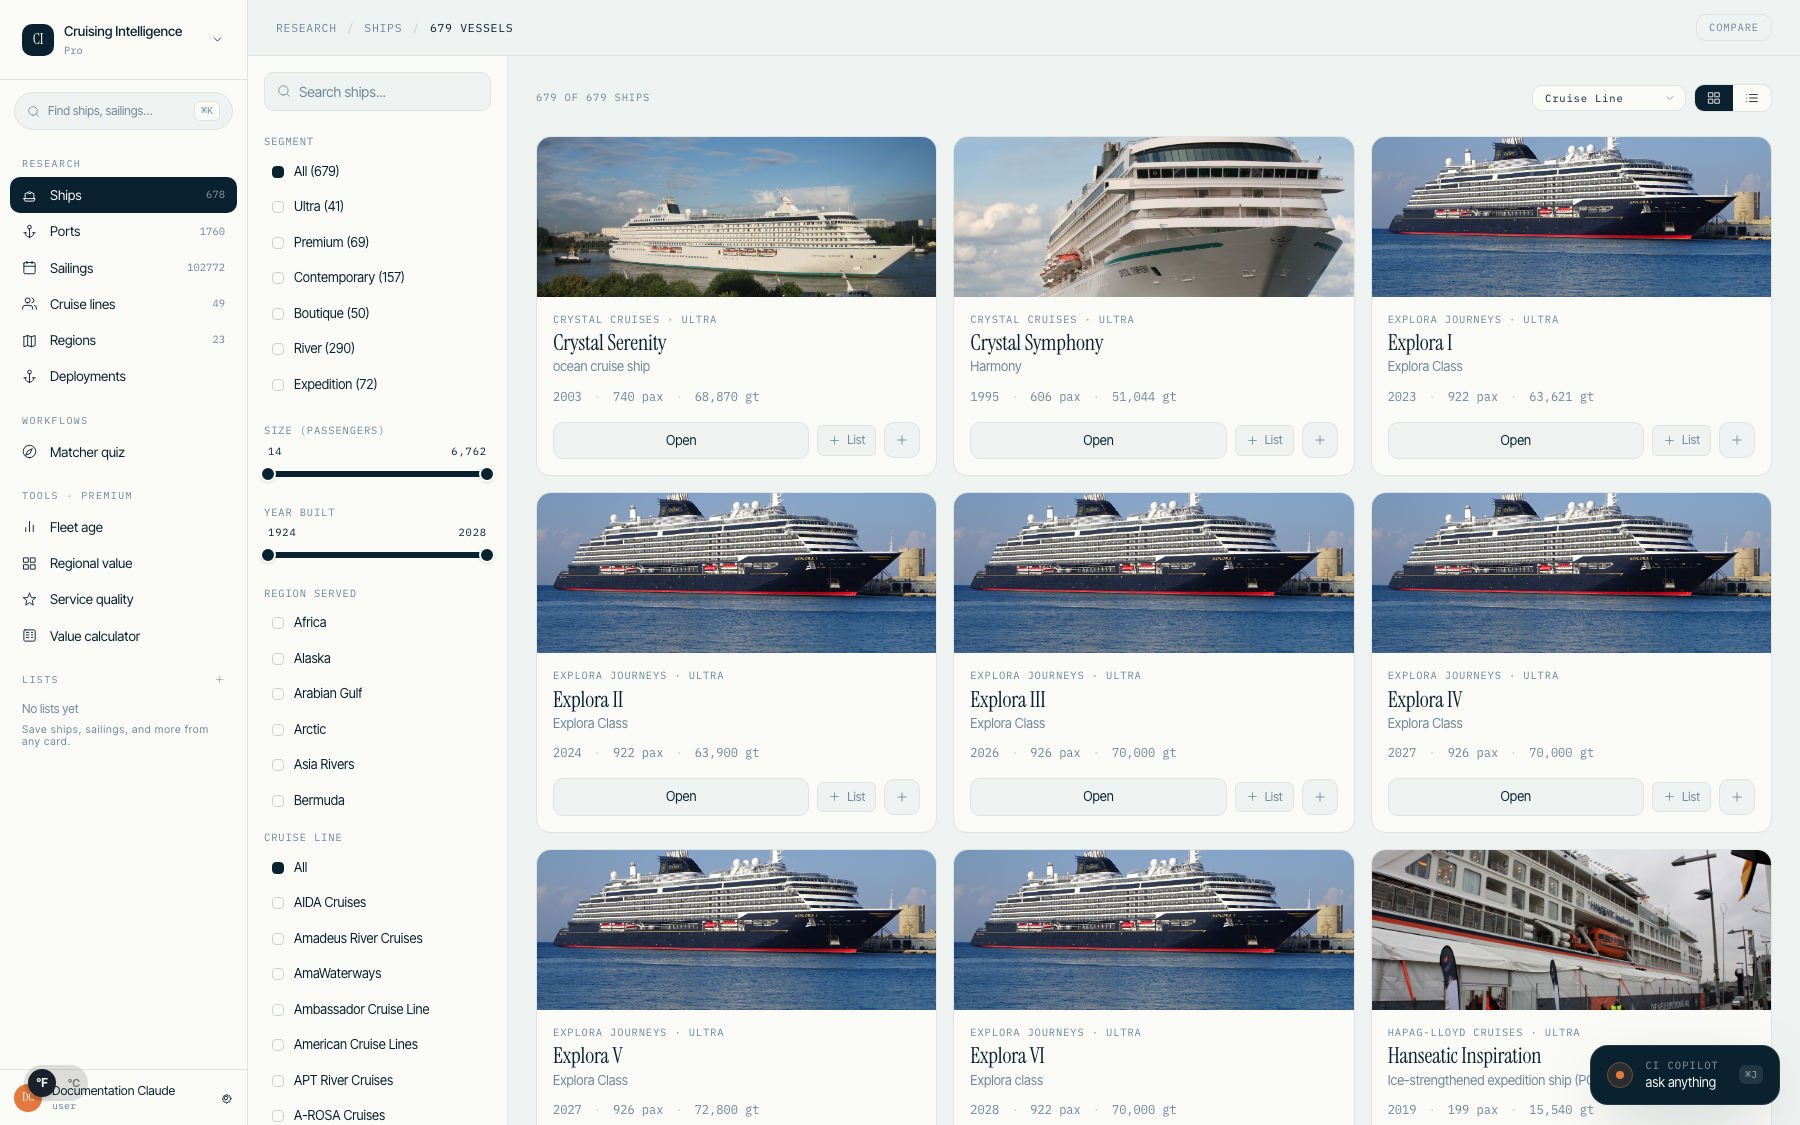
Filter Rail
Use the 260px left filter rail to narrow your search:
- •Search — Type a ship name to find it instantly
- •Best For — Filter by traveler profile (Families, Couples, Luxury Seekers, Solo, Adventure, Budget)
- •Size — Dual range slider for passenger capacity
- •Year Built — Dual range slider for launch year
- •Region Served — Filter to ships deployed in a specific region
- •Cruise Line — Filter by specific cruise line
Sort
The sort dropdown lives in the results header (not the filter rail) for quick access. Sort by name, capacity, gross tonnage, or newest first.
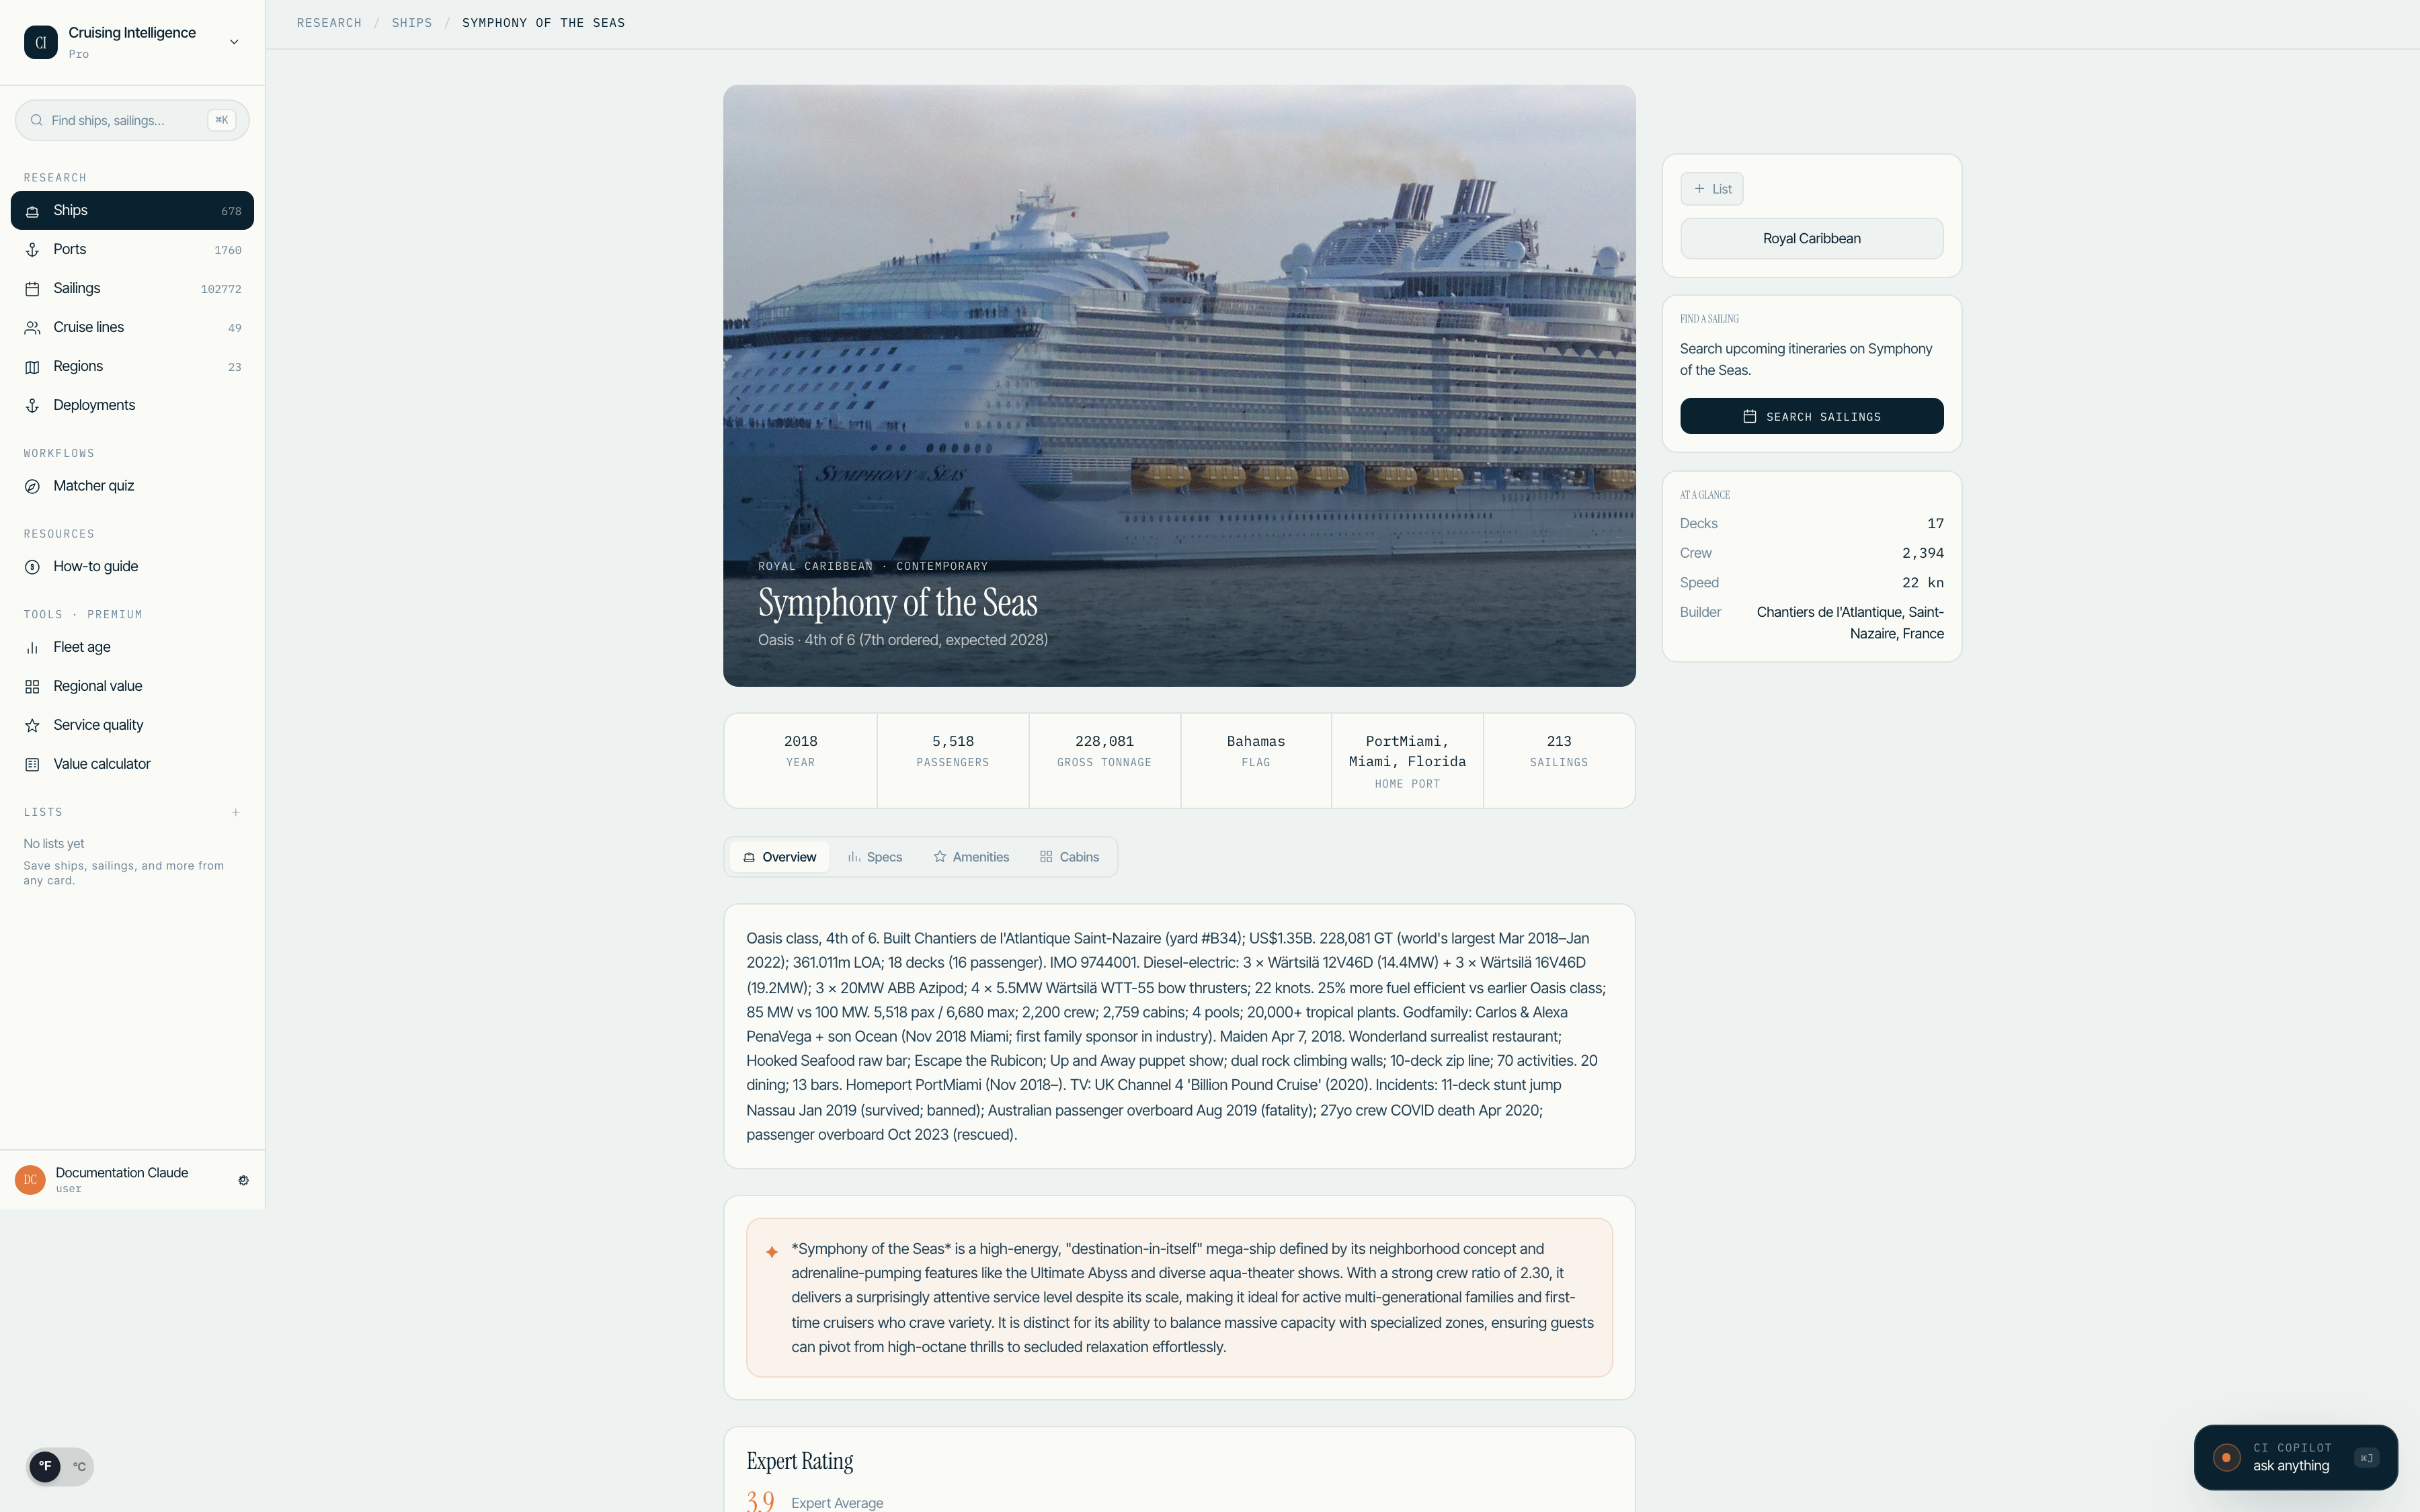
Ship Detail Page
Click any ship card to view its full profile including:
- •Hero image with coordinate tag and ship name in Instrument Serif
- •Fact strip: year built · passenger capacity · gross tonnage · flag · home port · itinerary count
- •CIC Composite Rating with category breakdowns
- •Dining venues, bars, cabin categories, and unique features
- •Persona-based insights when you select a traveler profile
The "Best For" persona filter uses FalkorDB graph intelligence to surface ships whose cruise lines explicitly target your selected traveler type. This is different from generic ratings — it is a targeting signal.
4.Sailing Search
Search through every active sailing across all cruise lines and regions.
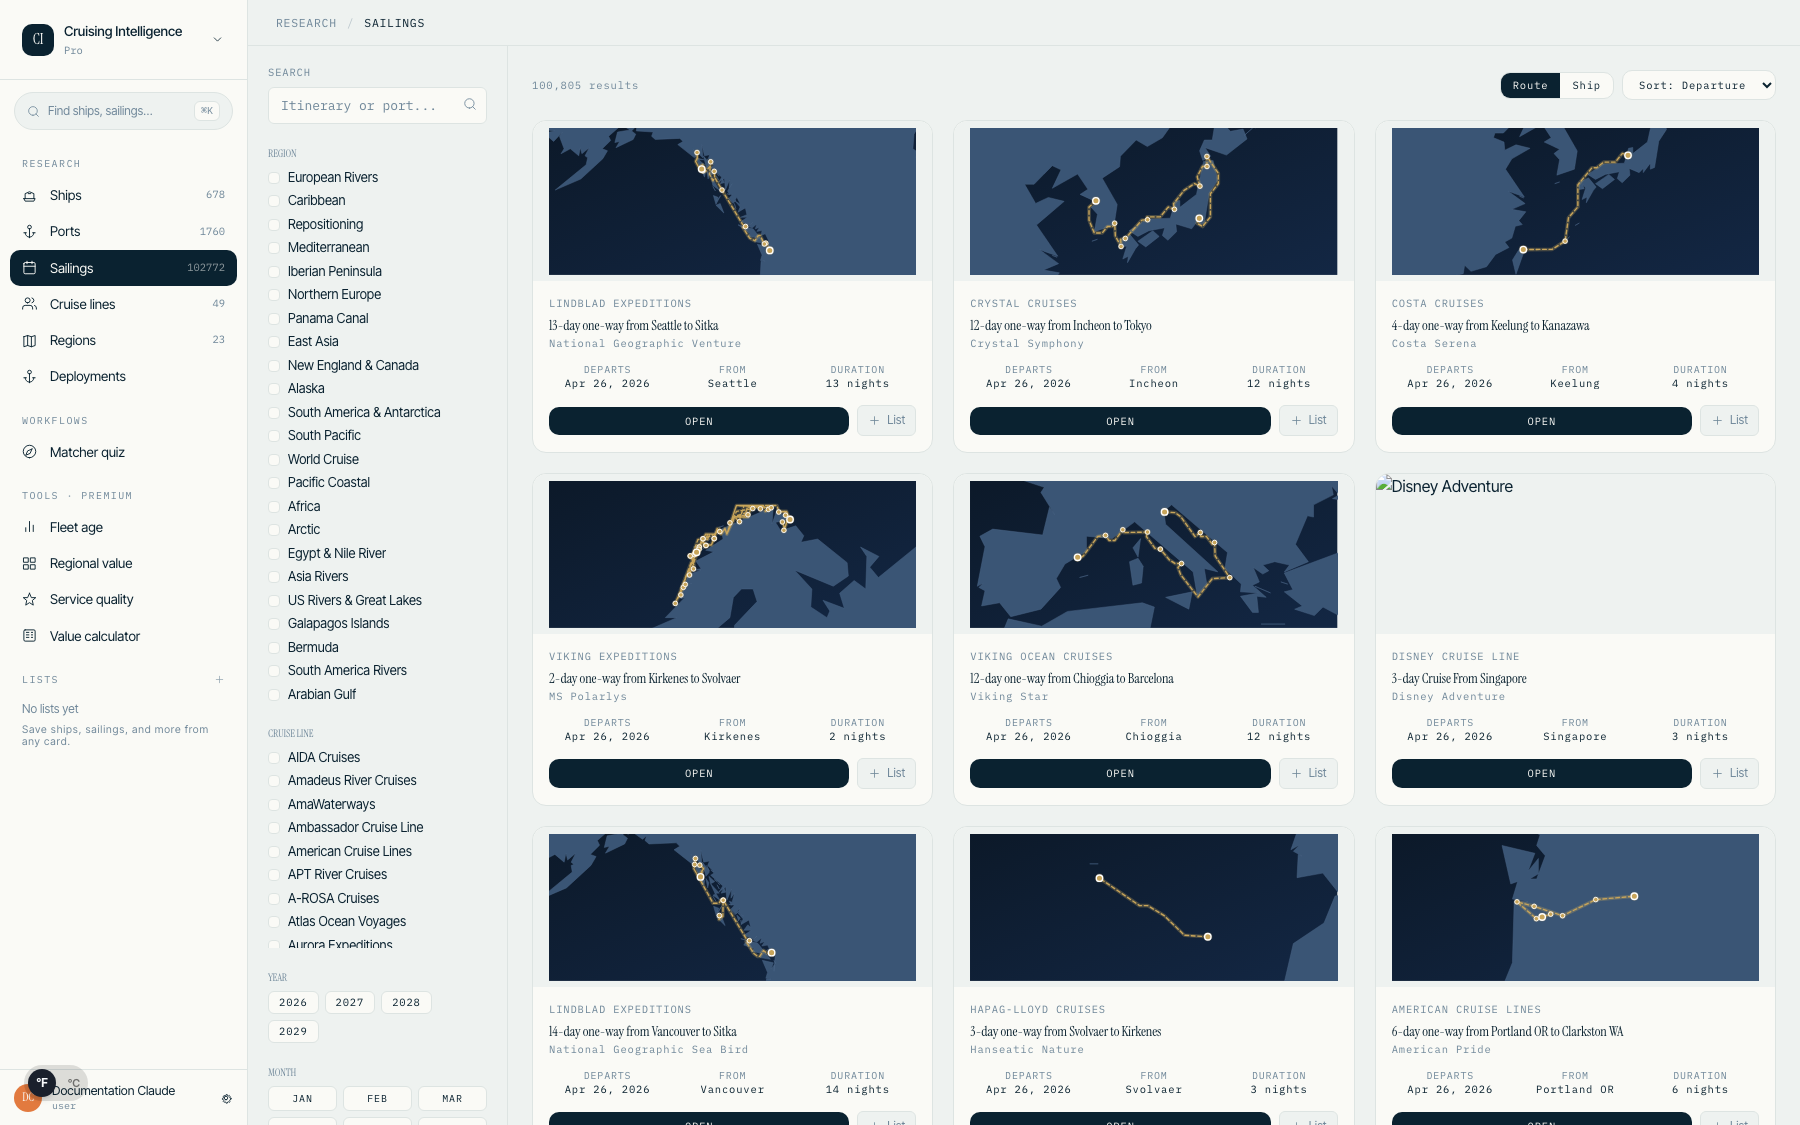
Finding Sailings
Navigate to Sailings from the left rail. Each card shows the ship photo, route details, departure date, and duration. Filter by region, cruise line, year, month, duration, and departure port.
Persona Filter
The "Best For" filter in the left rail lets you filter sailings by traveler profile. When selected, the search queries FalkorDB for ships whose cruise line targets that profile, then filters results to only those ships.
Duration Slider
The duration filter uses a dual range slider (not min/max inputs) to set both minimum and maximum trip length in one gesture.
Itinerary Details
Click any sailing card to open the detail page with three tabs:
- •Overview — Ship specs, departure info, and port-by-port conditions including weather, sea state, and air quality
- •Route Map — Pre-computed SVG map showing the cruise route with sea-routed lines, numbered port markers, and port name labels
- •Ports — Real weather data, marine conditions, and air quality at each port of call
Similar Sailings
At the bottom of the results, a "Similar Sailings" strip shows cruises on comparable ships in the same region and season. This helps you present alternatives without starting a new search.
5.Itinerary Detail & Export
Every sailing has a dedicated detail page with comprehensive information and a professional export for client sharing.
Itinerary Detail Page
The detail page includes:
- •Day-by-day timeline with port names, arrival/departure times, and sea days
- •Ports grid showing each destination with thumbnail, climate zone, and visit count
- •Route map tab with an SVG visualization of the full cruise path
- •Similar sailings carousel at the bottom for alternative recommendations
- •Persona-based insights (T1 fit, T5 risks, T6 ship-corridor fit, T7 line personality) when you click a traveler profile badge
Exporting Itineraries
Click Export PDF to generate a professional four-page itinerary document:
- •Page 1 — Cover with client name, advisor name, cruise line branding, and trip summary
- •Page 2 — Day-by-day breakdown with port conditions and notes
- •Page 3 — Route overview map and shore excursion placeholders per port
- •Page 4 — Known advisories and advisor contact card
The export uses your account name and profile information automatically. Make sure your advisor profile is complete in Settings for the contact card to render correctly.
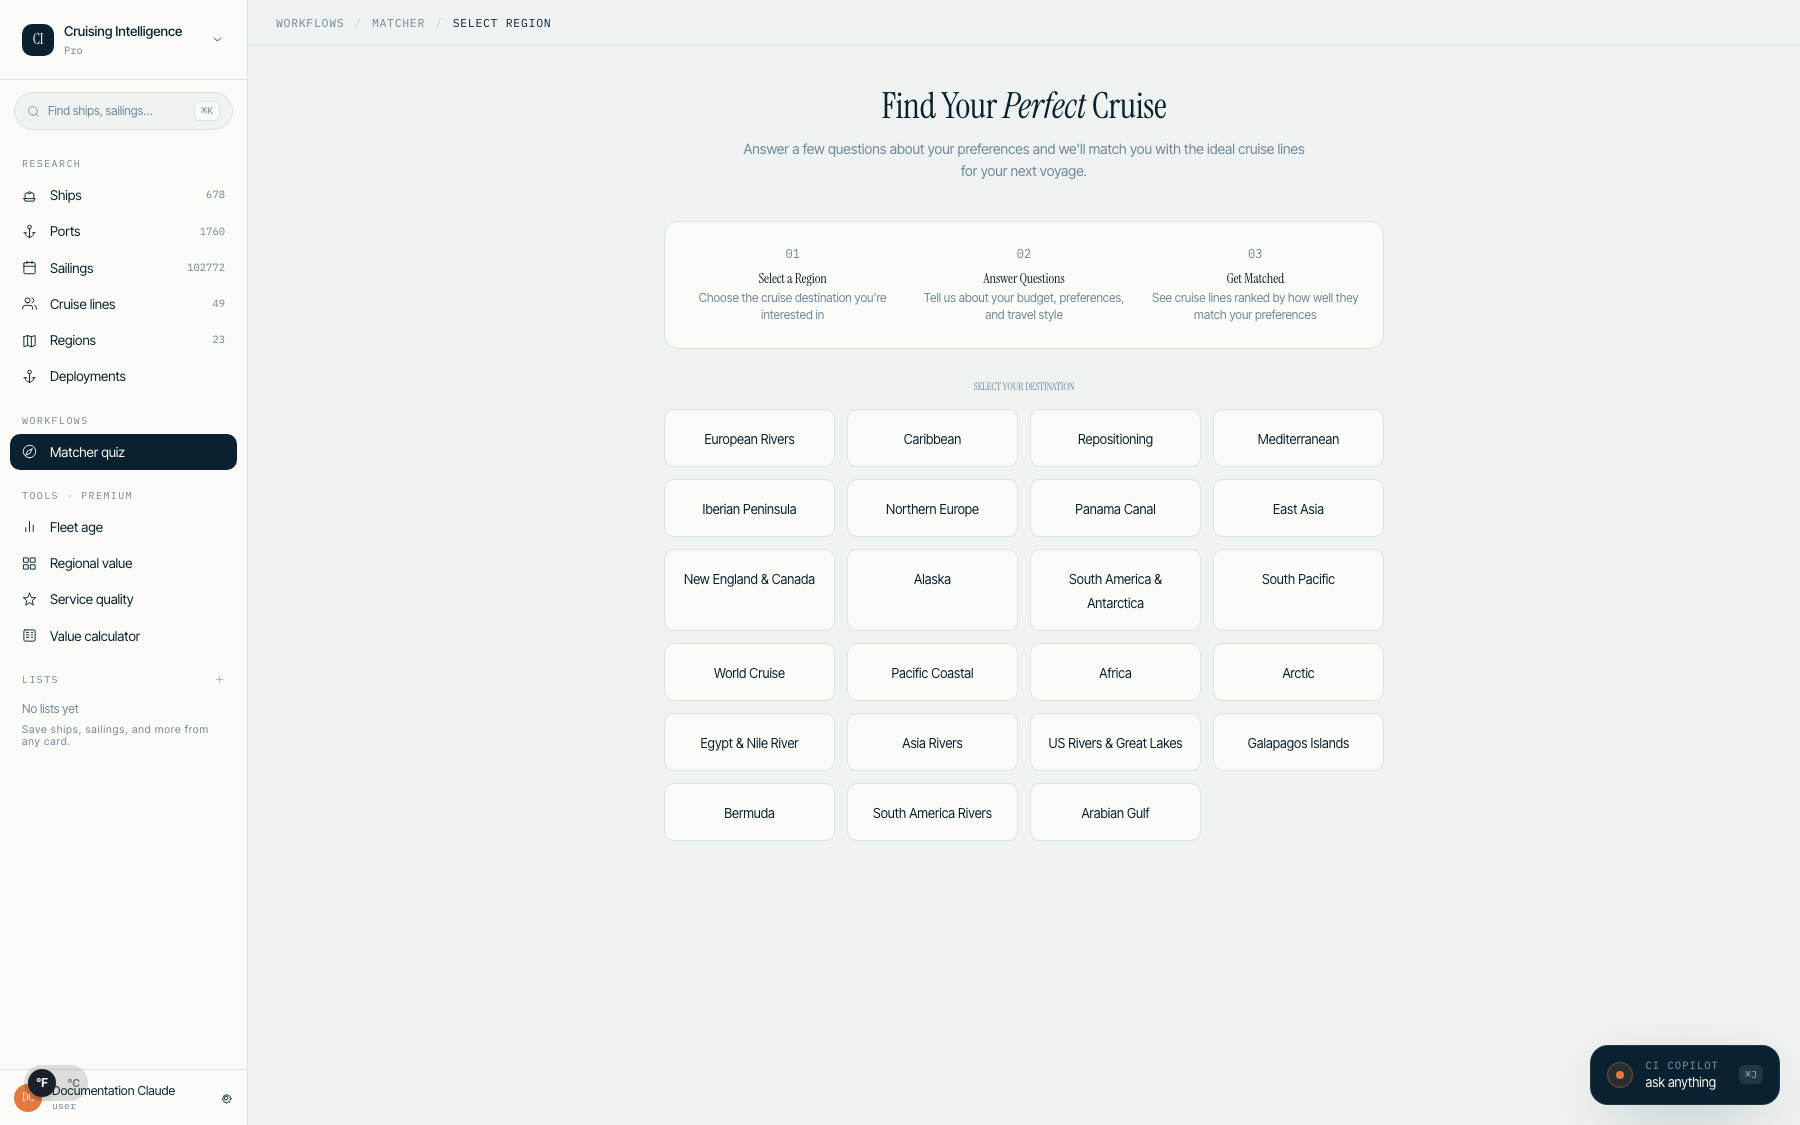
6.Cruise Matcher Quiz
Help your clients find their perfect cruise line match. The quiz asks preference questions and scores every cruise line using demographics data, inclusions, and ratings.
Step 1: Select a Region
Begin by choosing a cruise region. The quiz tailors follow-up questions to that destination.
Step 2: Answer Preference Questions
The quiz presents twelve base questions using card-style radio options with an ink border on select. Topics include:
- •Travel companions (solo, couples, family, multigenerational)
- •Budget level and cabin preference
- •Atmosphere preference (elegant, adventurous, relaxed)
- •Priority areas (dining, entertainment, excursions, wellness)
- •Activity level and ship size preference
A mono dots progress indicator at the top shows how far along you are — no gradient bar, just clean step markers.
Step 3: Destination-Fit Supplements
After the base questions, up to five destination-specific supplements refine the match based on regional characteristics (weather, ports, activity level).
Step 4: View Results
Results are ranked by match percentage with a mono badge on each card (e.g., "94%"). Cards show the cruise line, match score, tier label, and recommended ships. Click Why these match to see the scoring breakdown.
Saving Results
Click Save as list to store the results for later reference, or Share with client to generate a shareable link.
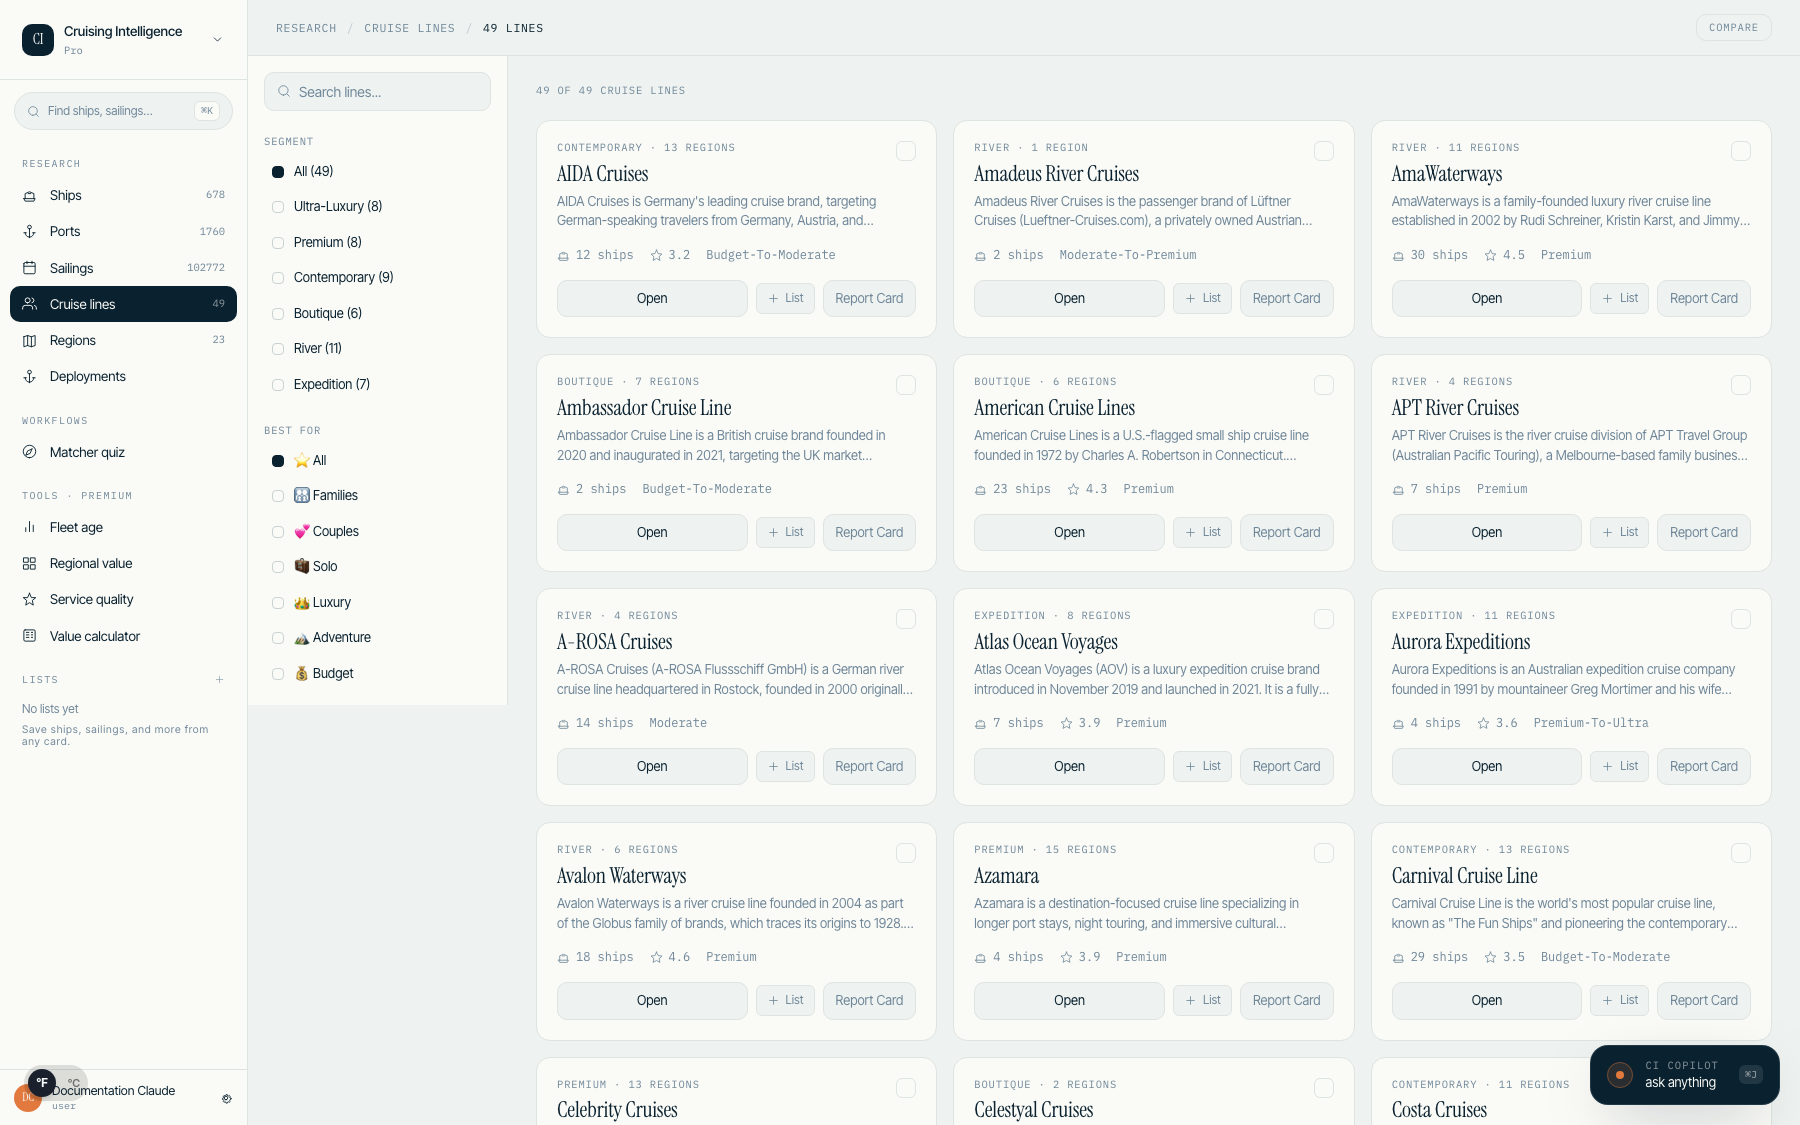
7.Cruise Line Pages
Every active cruise line has a dedicated profile with fleet information, inclusions, ratings, and expert assessments.
Cruise Line Directory
Navigate to Cruise Lines from the left rail to browse all active lines. Cards show the line logo, fleet size, CIC Composite Rating, and tier.
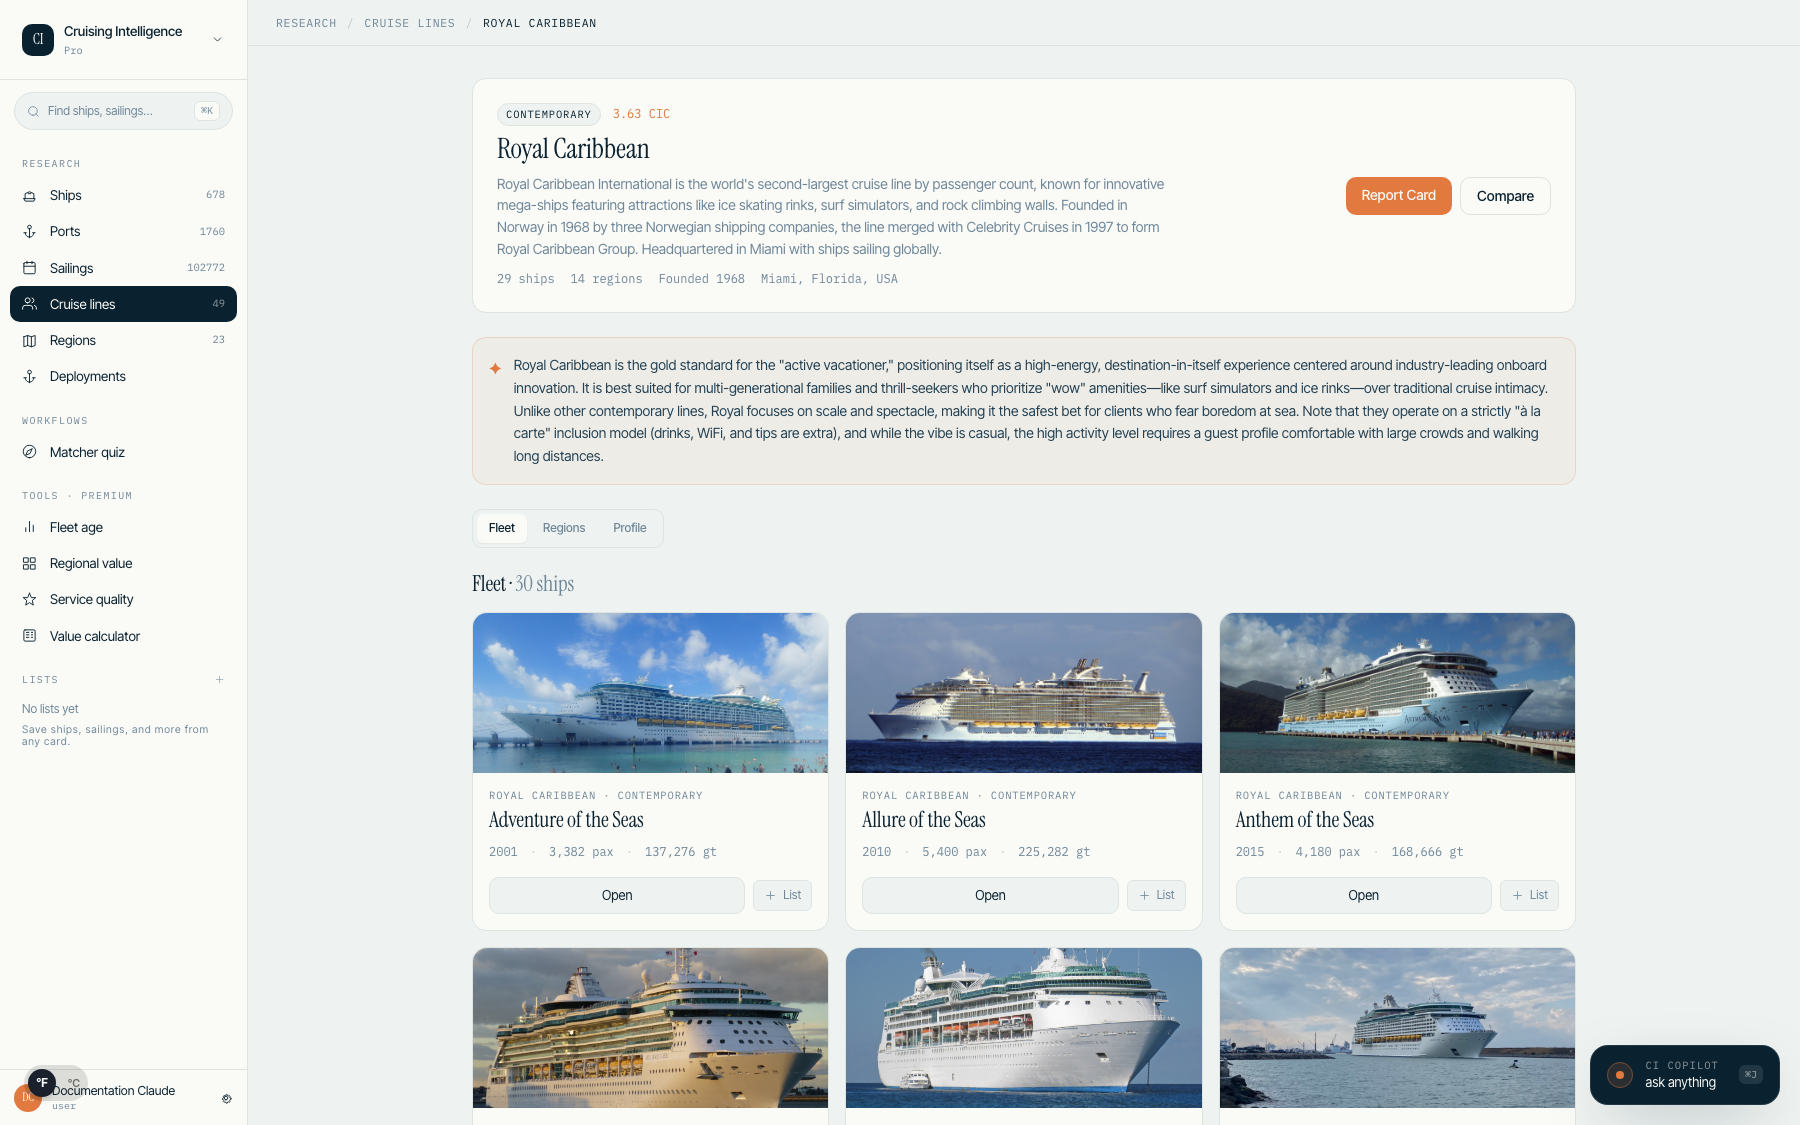
Cruise Line Profile
Each profile uses three tabs:
- •Fleet — All ships operated by the line, with capacity, year built, and rating
- •Regions — Where the line sails, with seasonal deployment counts
- •Profile — Inclusions grid, CIC rating breakdown, and expert summary
Report Card
Every line has a Report Card page showing letter grades (A, B, C, D) across categories like Dining, Service, Entertainment, and Value. Grades use Harbor semantic colors: A = sage, B = accent, C = amber, D = red.
Persona Insights
Click a traveler profile badge on the cruise line detail page to see pre-computed insights: line character (T7), corridor fit aggregates (T1/T5), and fleet match percentages (T6).
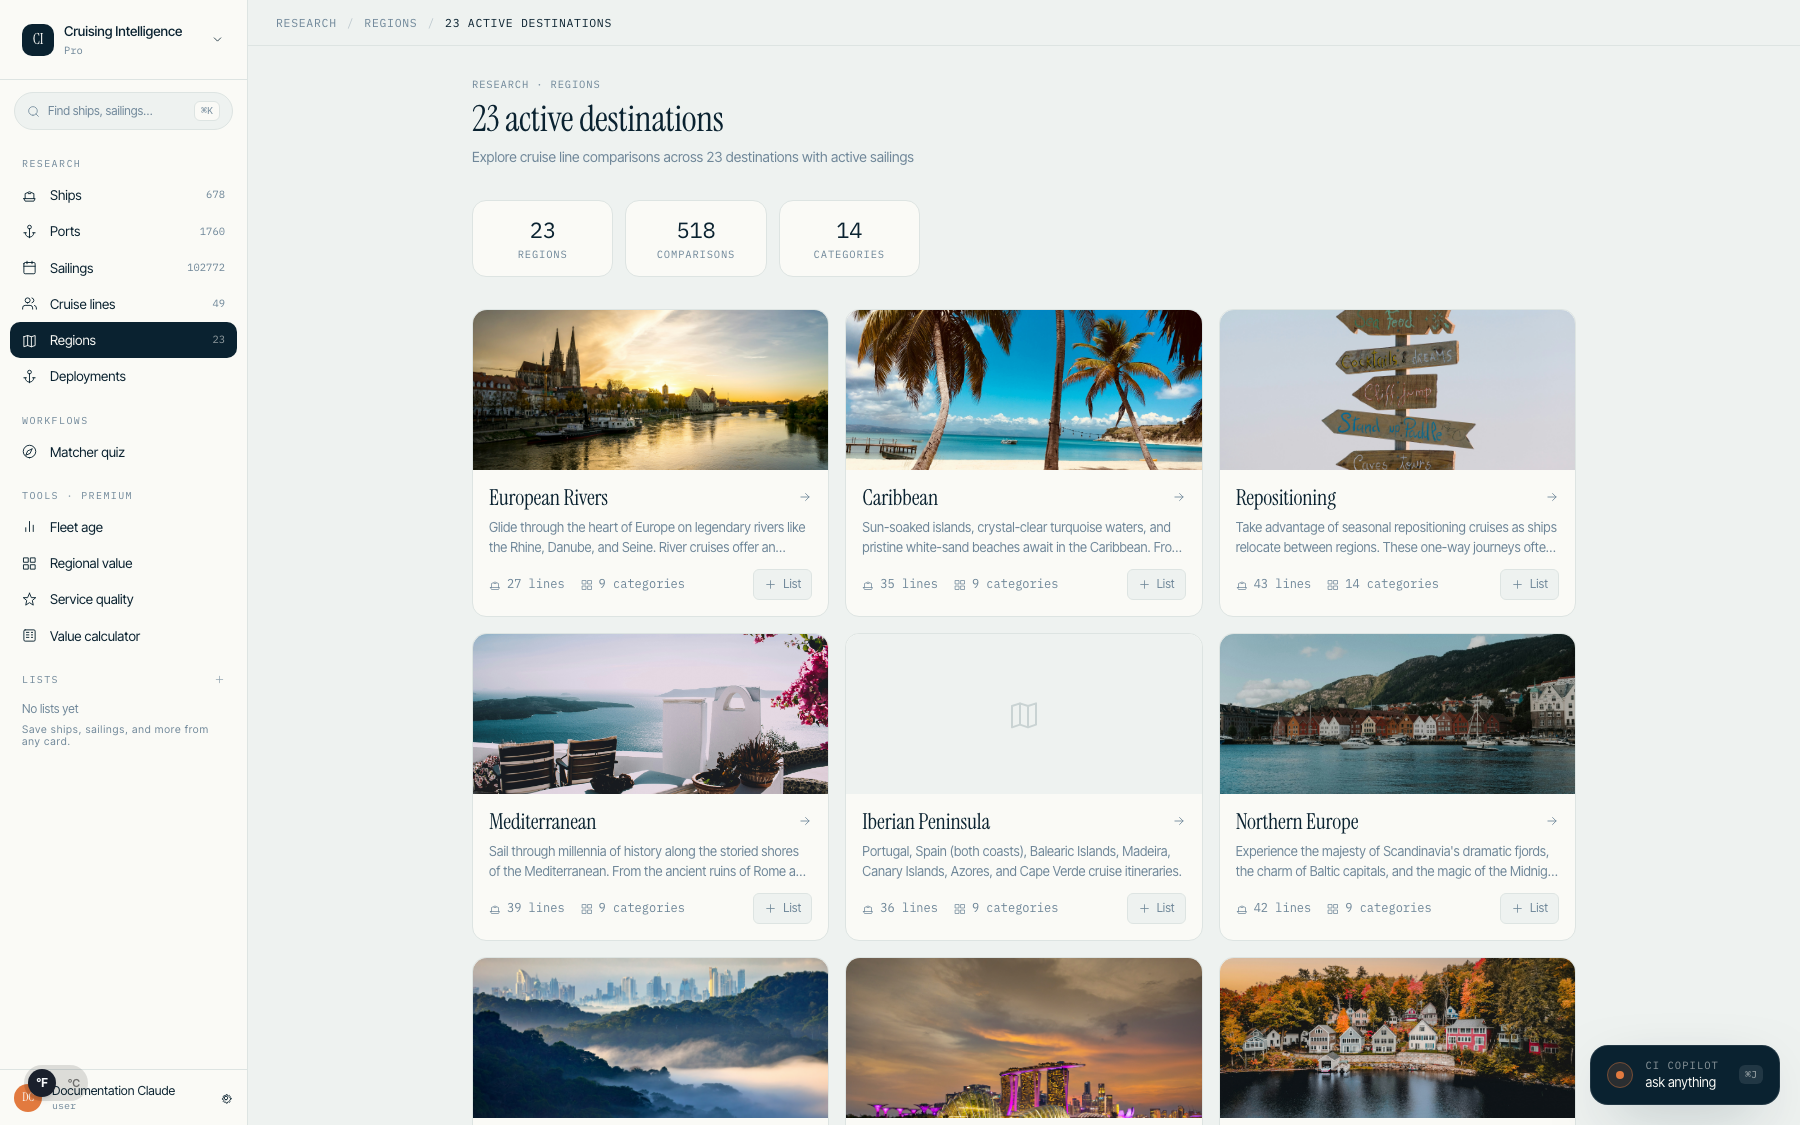
8.Regions & Port Intelligence
Explore active cruise destinations with cruise line comparisons, value analysis, and port intelligence.
Regions Grid
Navigate to Regions from the left rail to see all destinations with active sailings. Each card shows the region name and deployment density. The page header clarifies that the count shows "active destinations with sailings."
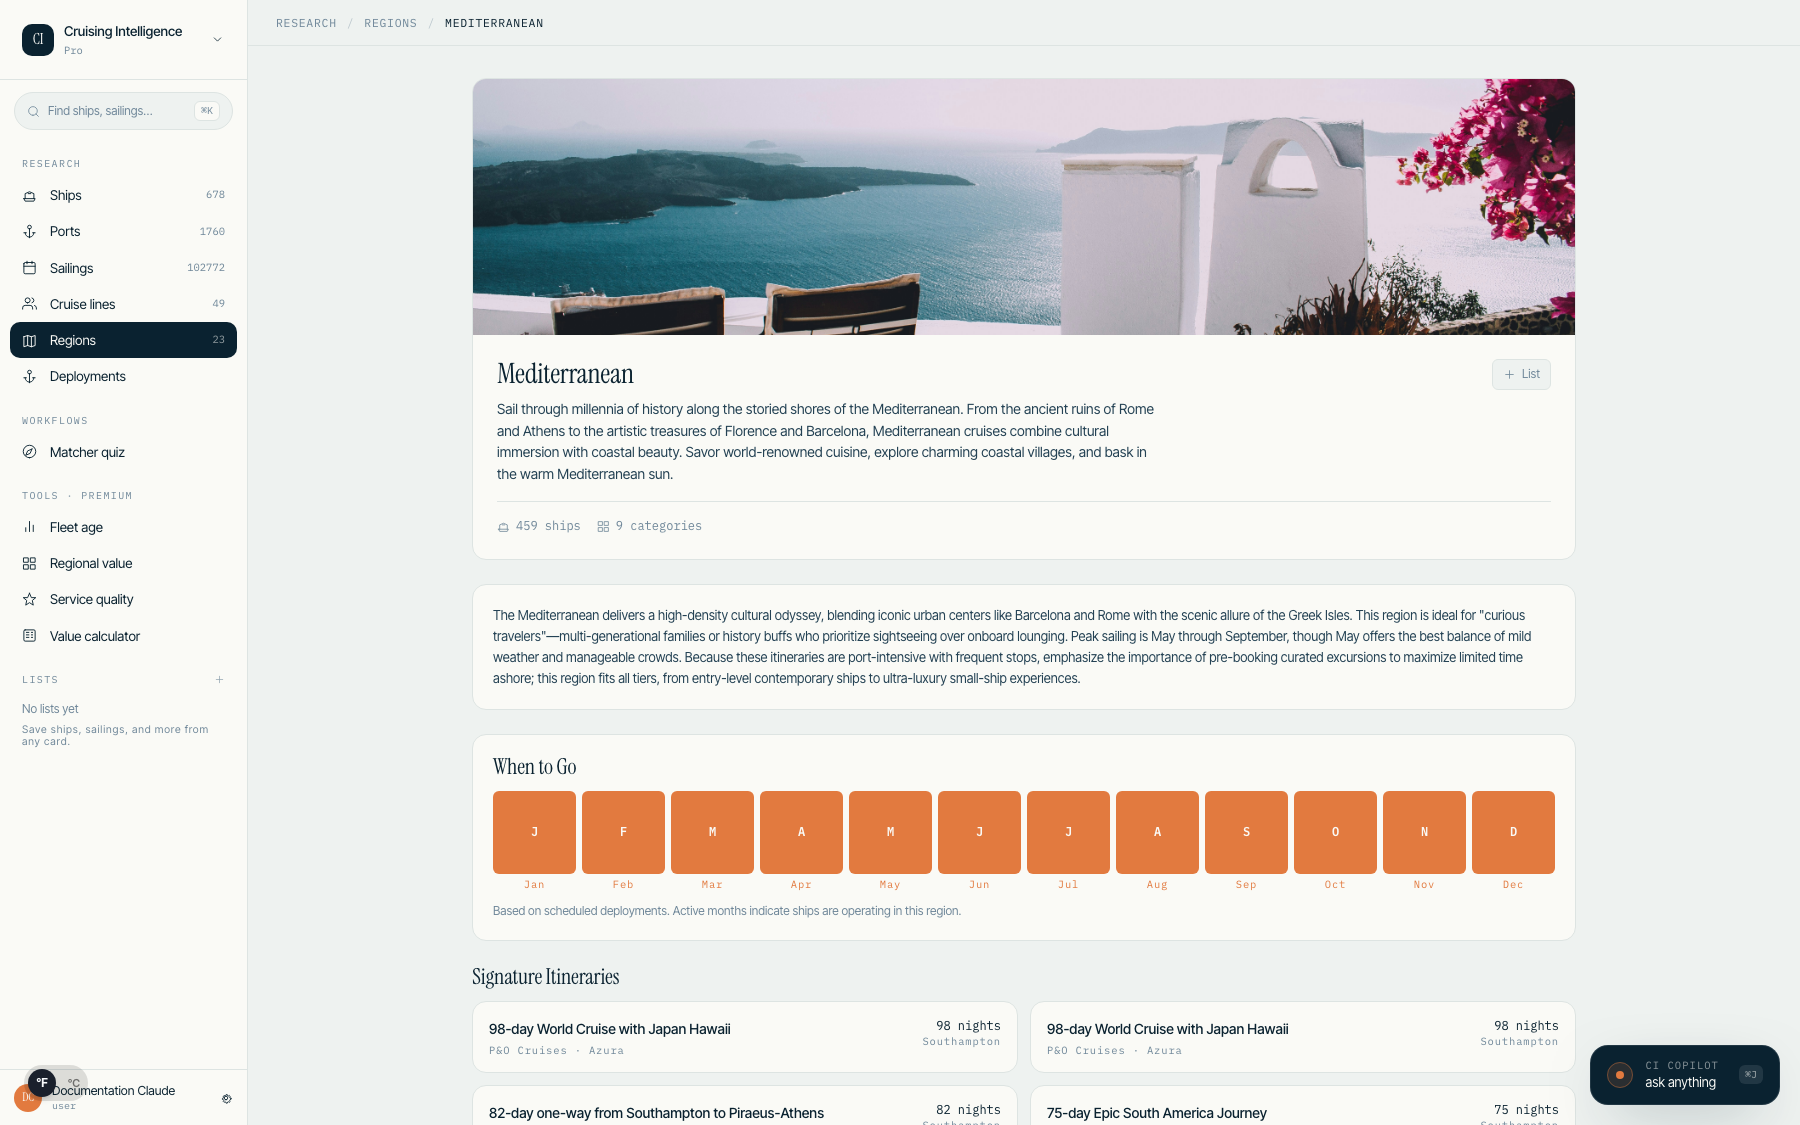
Region Detail
Each region page includes:
- •When to go — A 12-month strip showing deployment density by month, derived from actual sailing data
- •Top ports — A grid of the most-visited ports in the region, ranked by visit count
- •Signature itineraries — Four curated sailings from the region, selected from actual ship deployments
- •Cruise line comparison — See which lines operate in the region and how they compare on ratings and inclusions
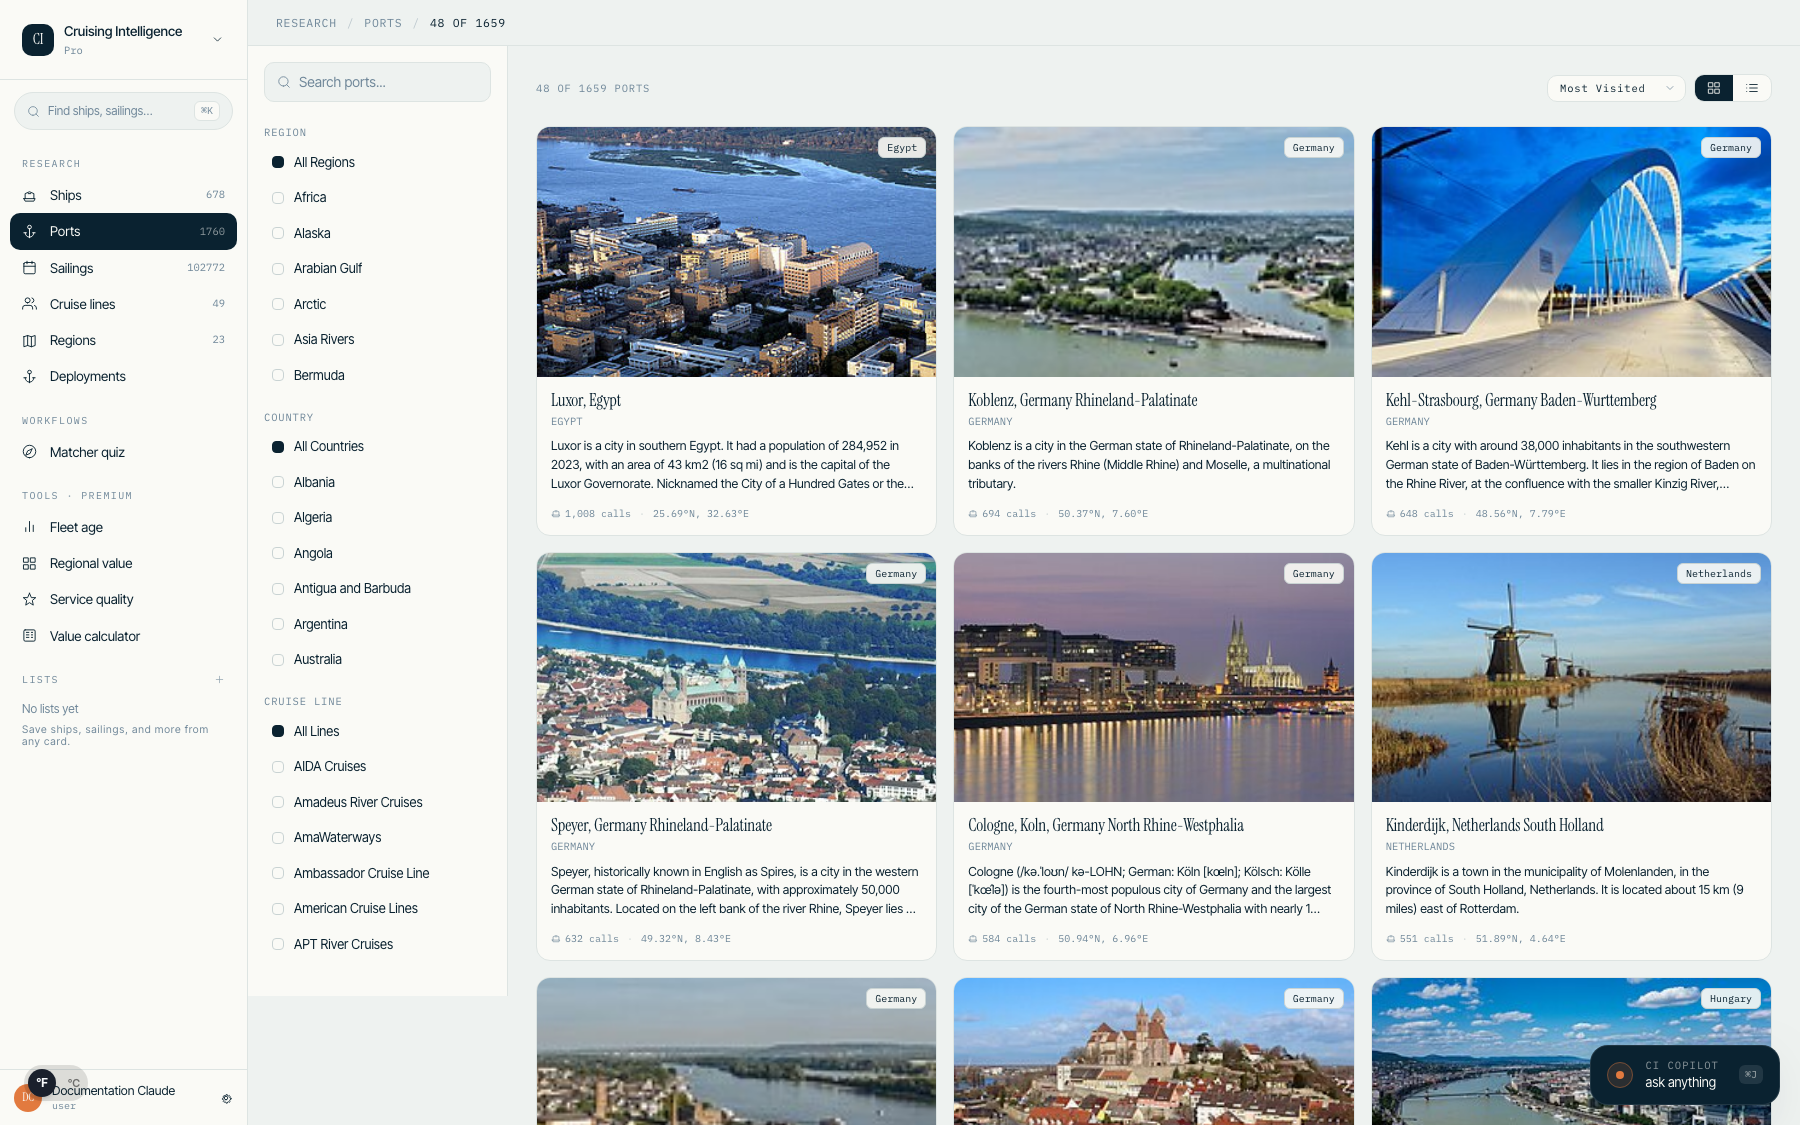
Port Research
Navigate to Ports from the left rail to browse every port with active sailings. The port browser matches the ships/sailings aesthetic with a 260px filter rail:
- •Search — Find ports by name, country, or region
- •Region filter — Hierarchical filter derived from route corridors
- •Destination filter — Filter by destination (e.g., "Alaska (One Way)") using readable display names
- •Country filter — Full country names via the cost index table
- •Cruise line filter — Only lines with matched port visits
Port Detail Page
Each port has a detail page with a hero image, coordinate tag, Wikipedia-sourced destination narrative, KPI strip (called-by lines/ships, peak rain, best month, AQI, visit count), a 12-month seasonality SVG chart, marine conditions, and upcoming sailings.
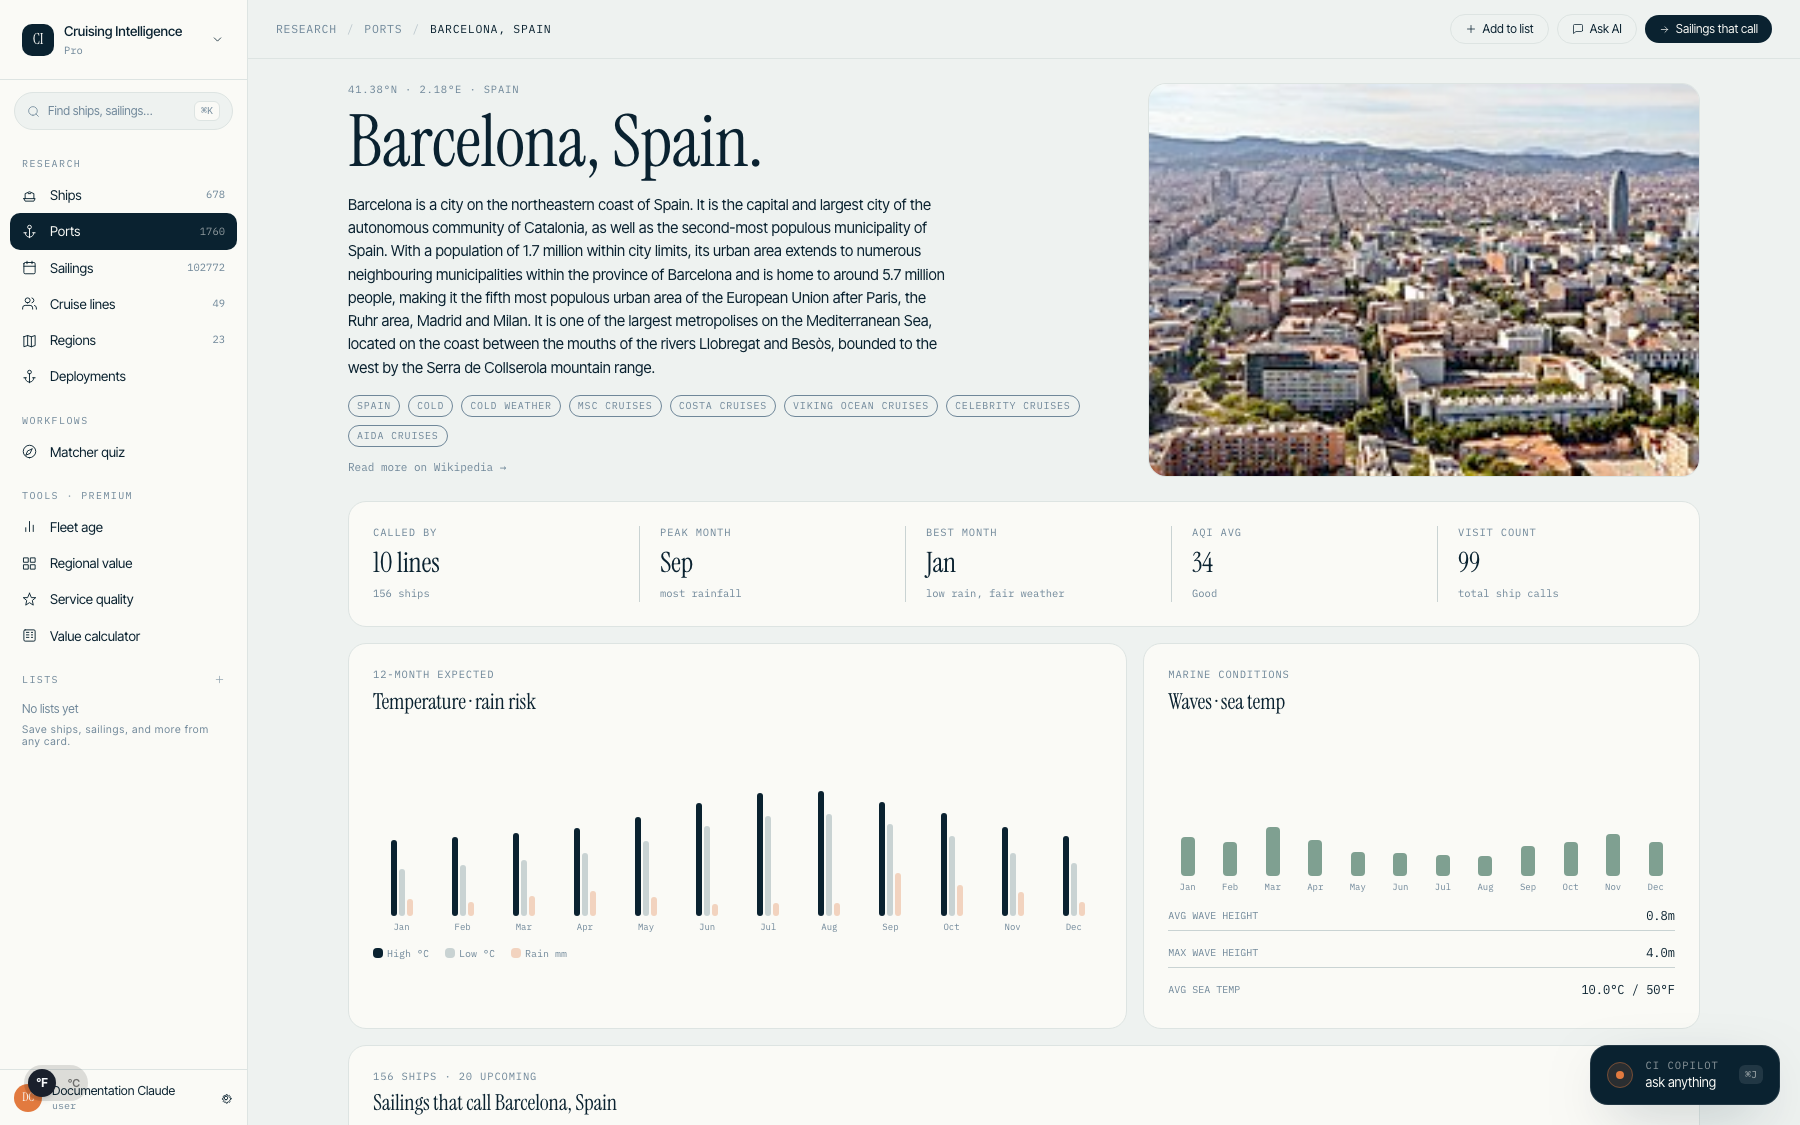
Port destination data is sourced from Wikipedia and validated by AI. If you spot an inaccurate extract or image, use the admin port editor to override it. The system will prefer your override over the automated source.
9.Deployment Grid
The Deployment Grid is the flagship analytical surface. It shows exactly who sails where, every season, at a glance.
Grid Layout
Rows are cruise lines. Columns are regions. Each cell uses density visualization: empty for no sailings, a dot for 1 sailing, light fill for 2–4, and solid accent for 5+. Sticky left column keeps line names visible while scrolling.
View Modes
Toggle between three views in the top bar:
- •Grid — Density visualization with color-coded cells
- •Heatmap — Intensity shading for quick pattern spotting
- •List — Text-based list for accessibility and copy-paste
Cell Detail Drawer
Click any cell to open a side drawer showing the exact ships sailing that line-region combination, with deep links to ship detail pages.
Highlights Strip
Below the grid, a highlights strip calls out: biggest mover (largest deployment increase), coverage gap (regions with no sailings for a line), concentration (lines with dense single-region focus), and new entrant (lines newly entering a region).
Season Selector
Use the season dropdown in the top bar to switch between Spring, Summer, Fall, and Winter. The grid updates instantly.
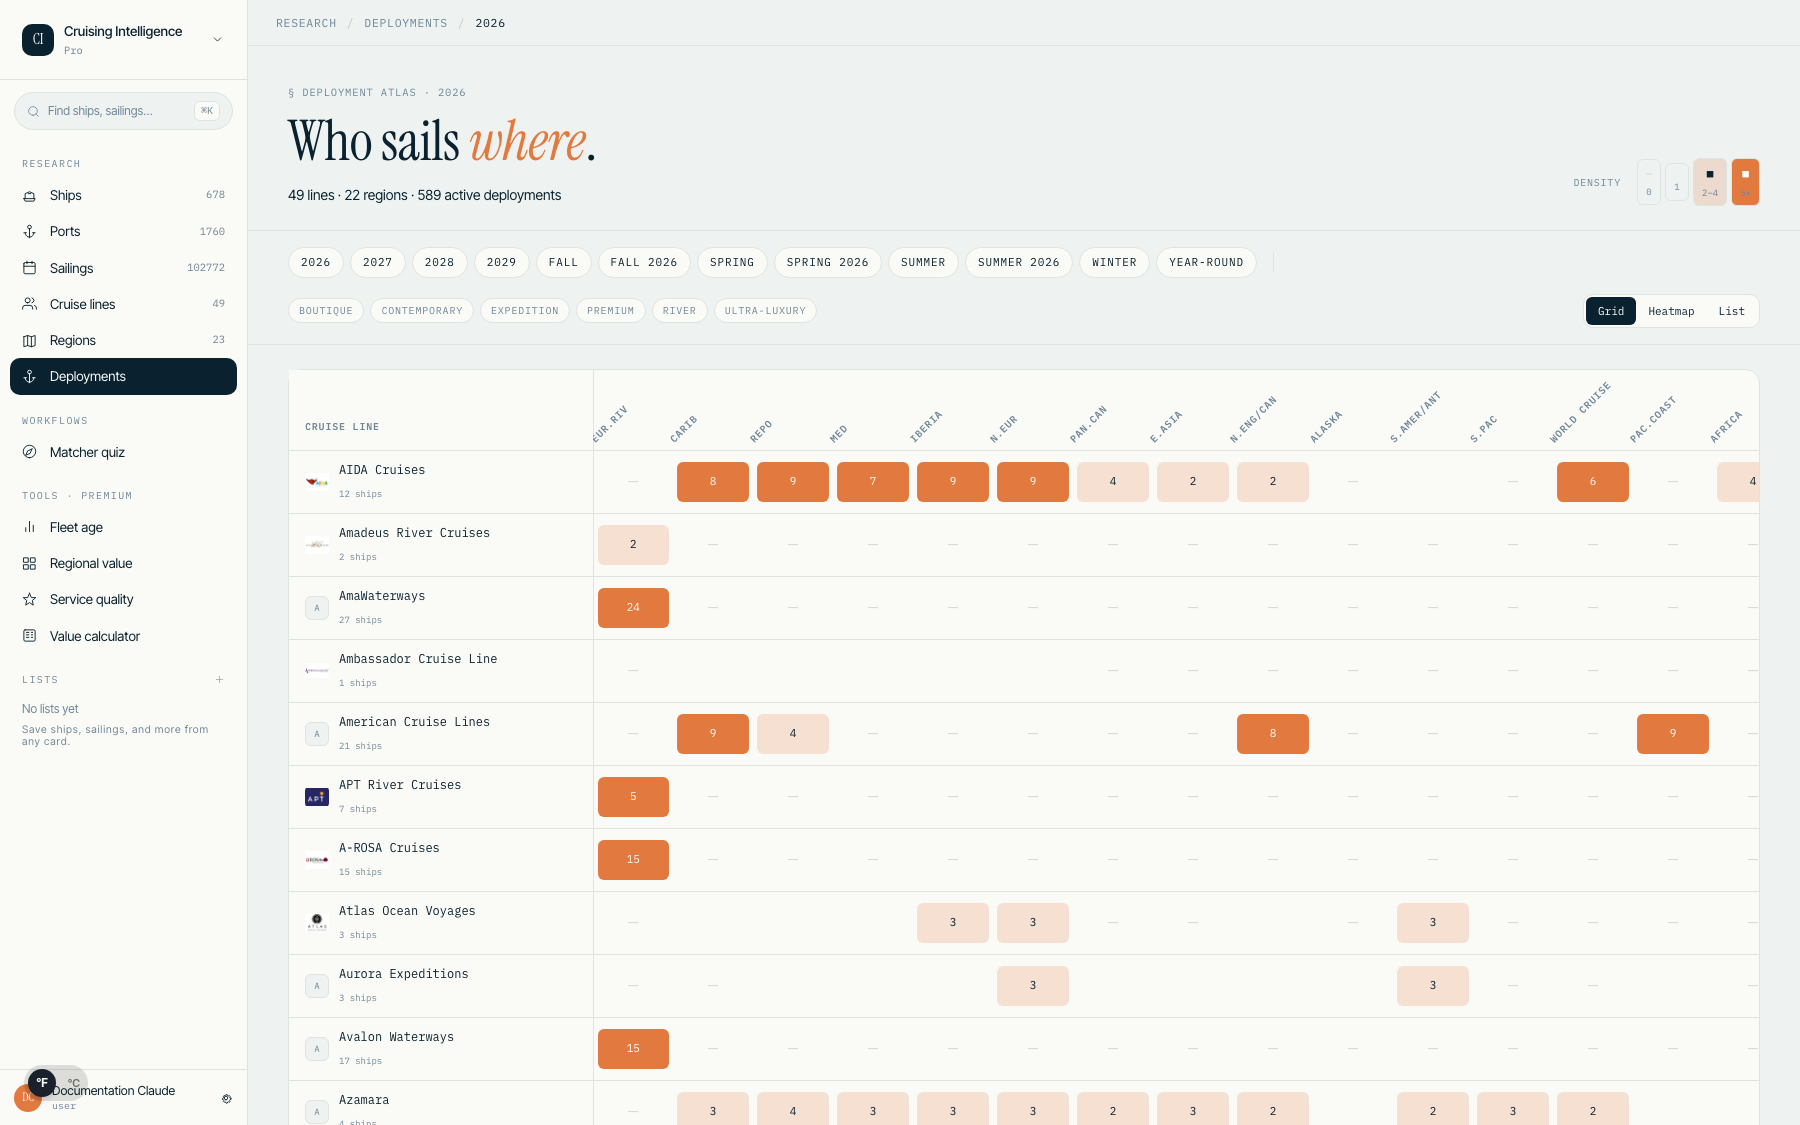
Basic plan users see a teaser grid (10 lines × 5 regions) with an upgrade overlay. Premium users see the full 49-line × 23-region grid.
10.Power Tools
Four analytics tools give you data-backed talking points for client conversations. All tools are tier-gated: Basic users see a teaser with an upgrade CTA; Premium users see the full tool.
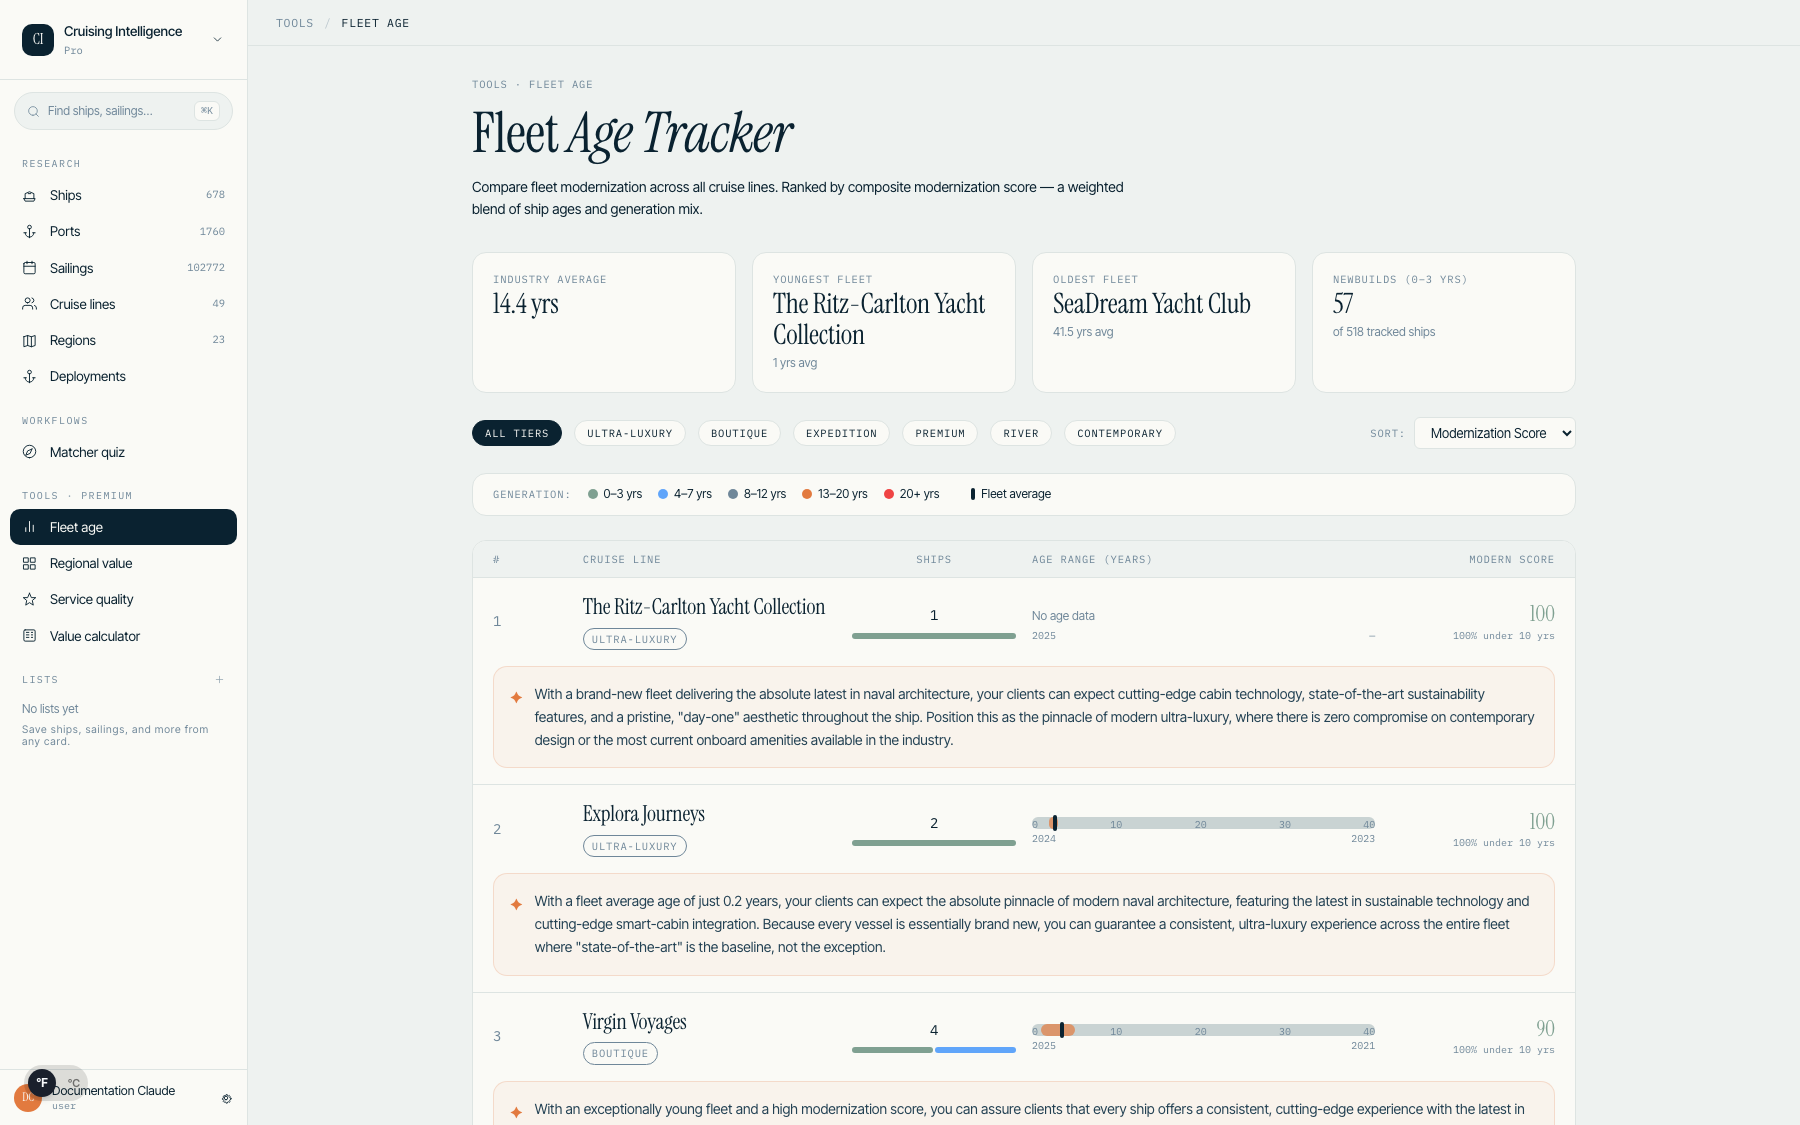
Fleet Age Tracker
Track fleet modernization across cruise lines. The stat strip shows industry average age, youngest fleet, oldest fleet, and newbuild count. The ranked table includes a range bar per line so you can see age distribution at a glance.
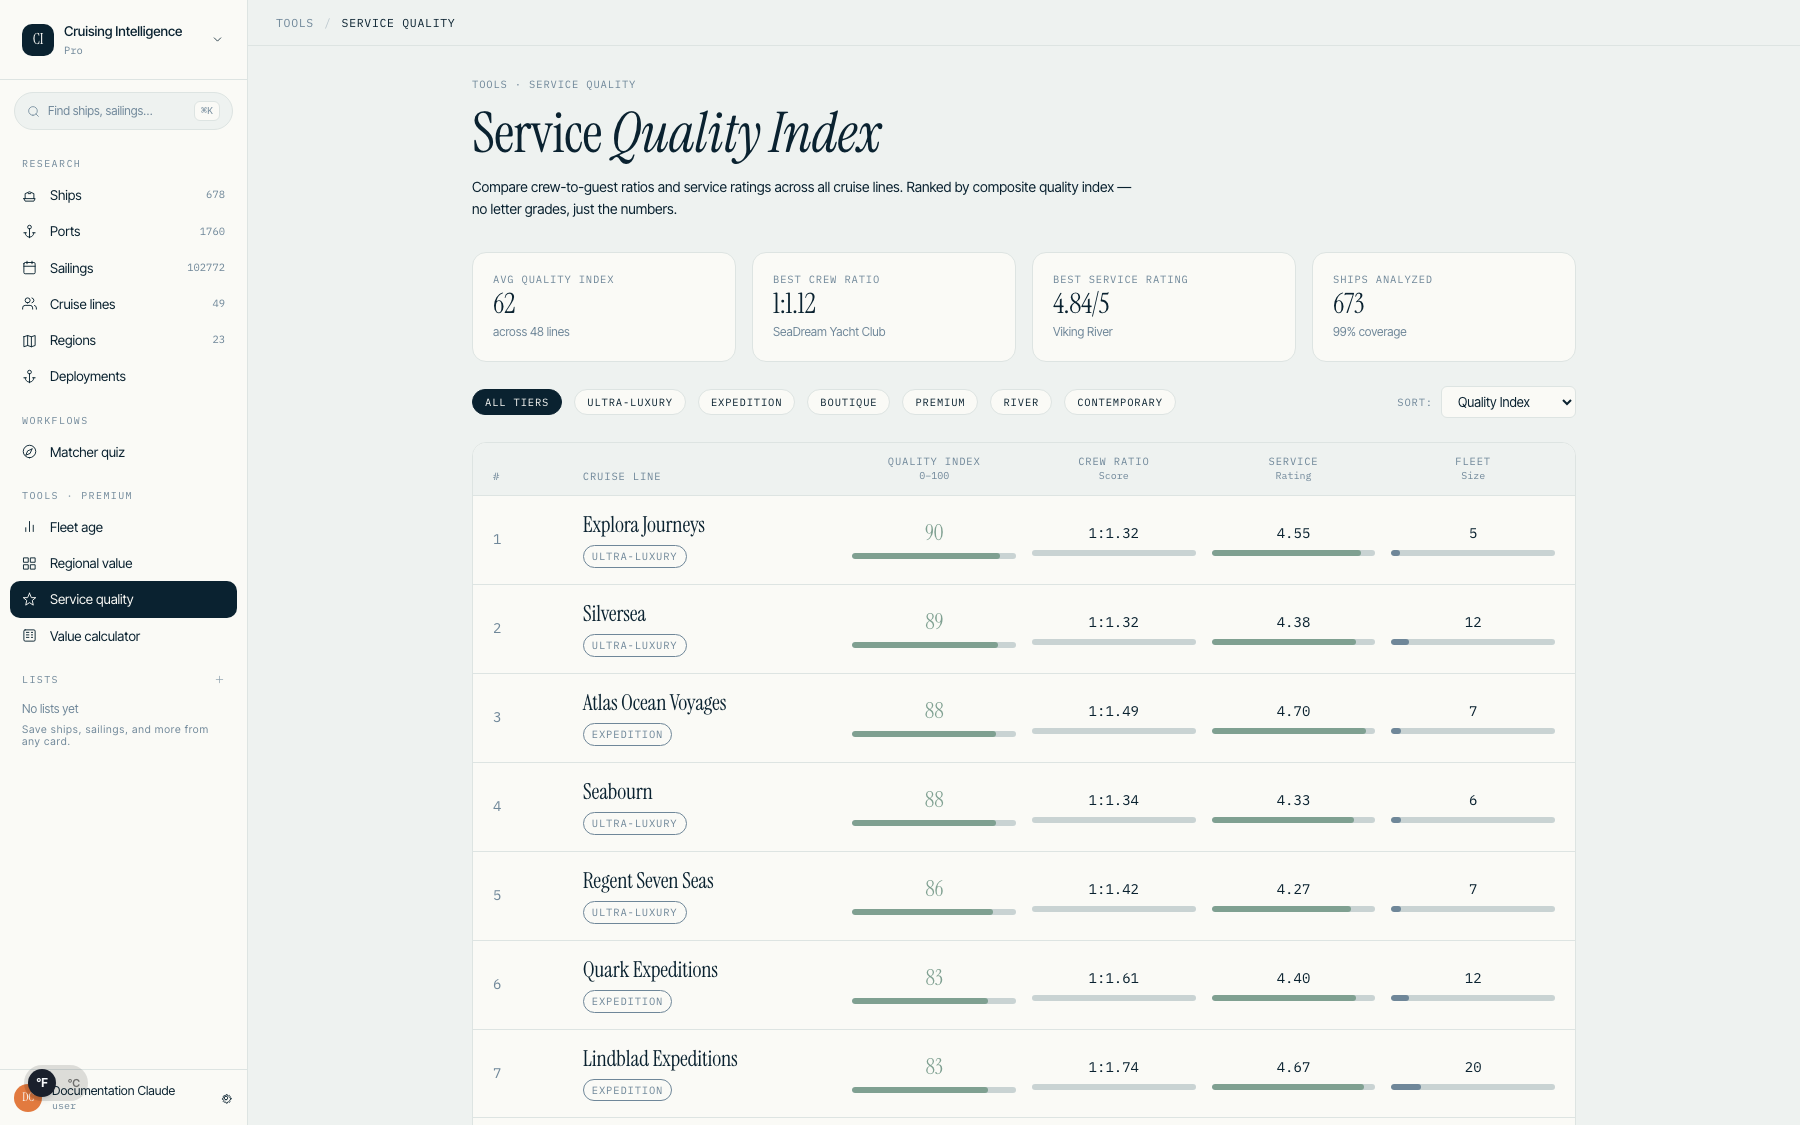
Service Quality Index
Analyze crew-to-guest ratios and composite service scores. The ranked table uses 6px mini-bars for four dimensions (service, dining, entertainment, cabins). No letter grades — numeric scores only, so you can quote exact figures.
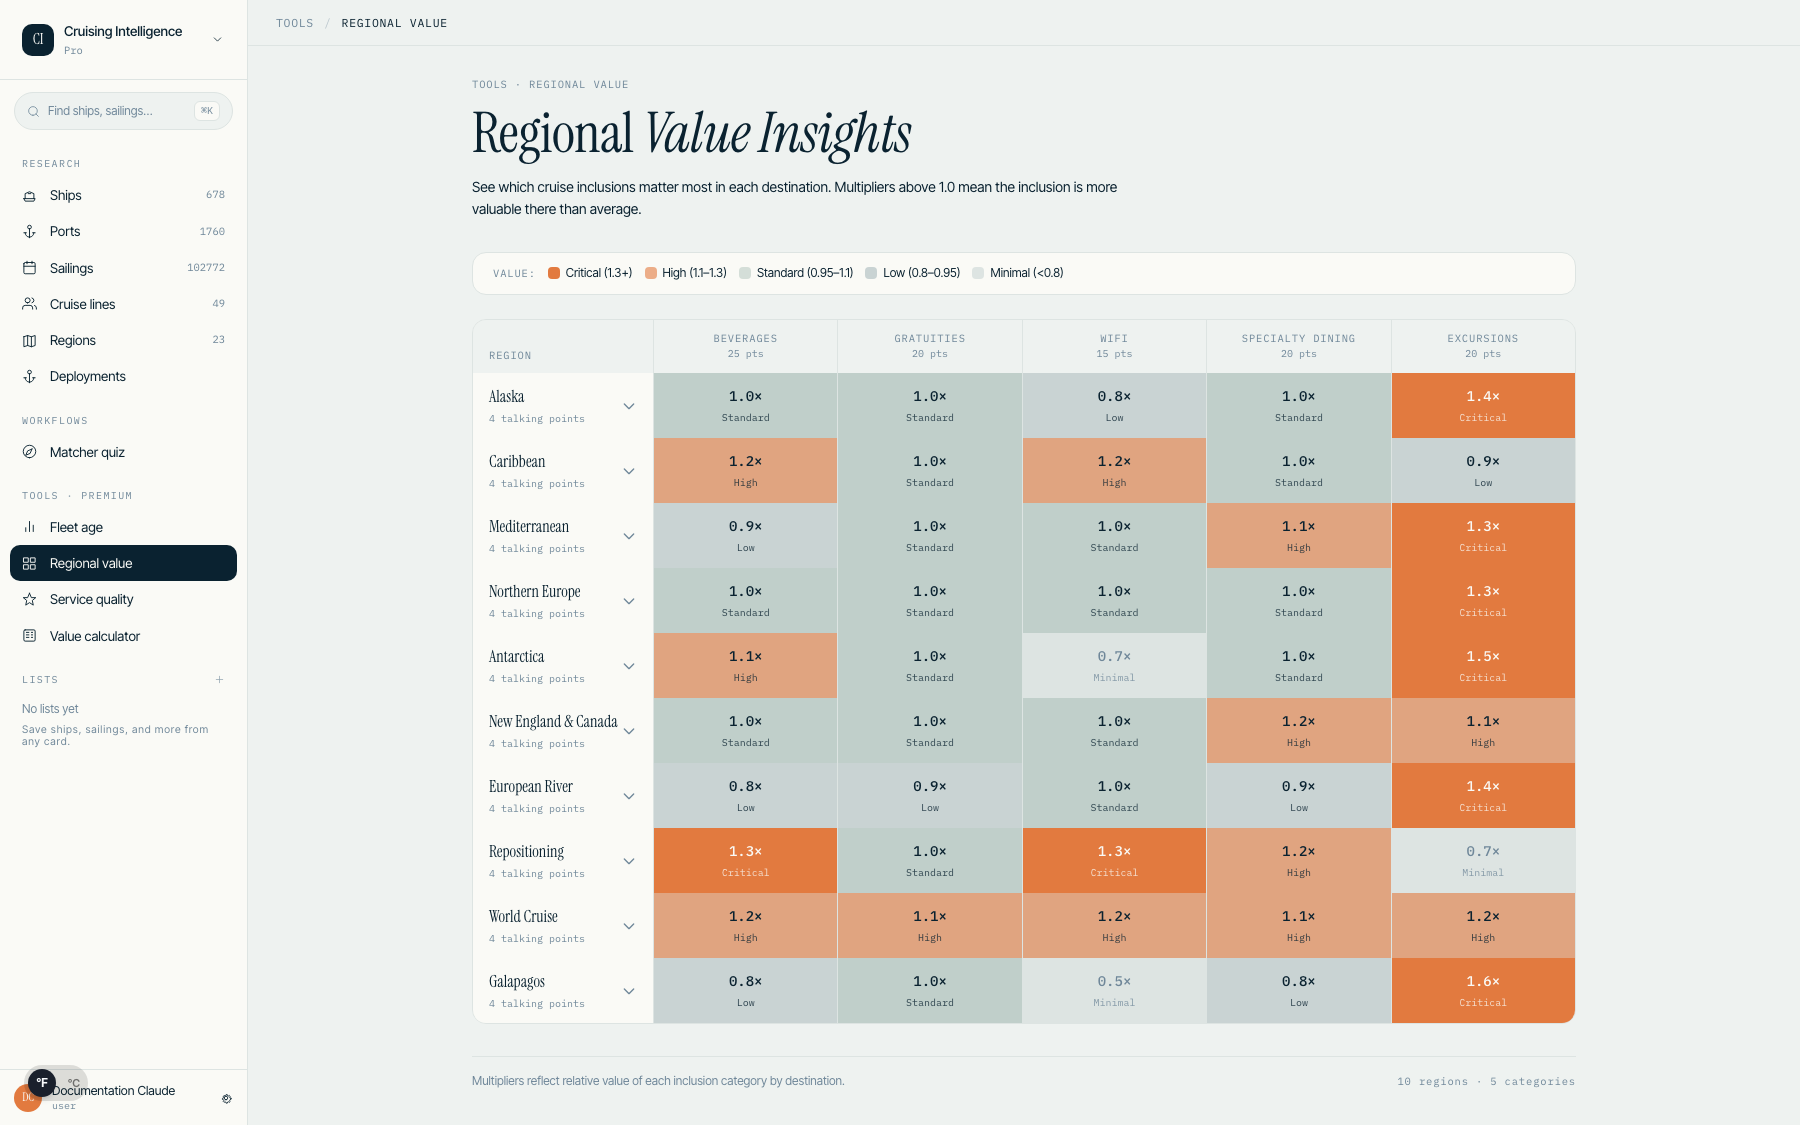
Regional Value
Compare what is included in cruise fares across regions. A heatmap with five-color score shading shows which lines offer the most inclusive packages per destination.
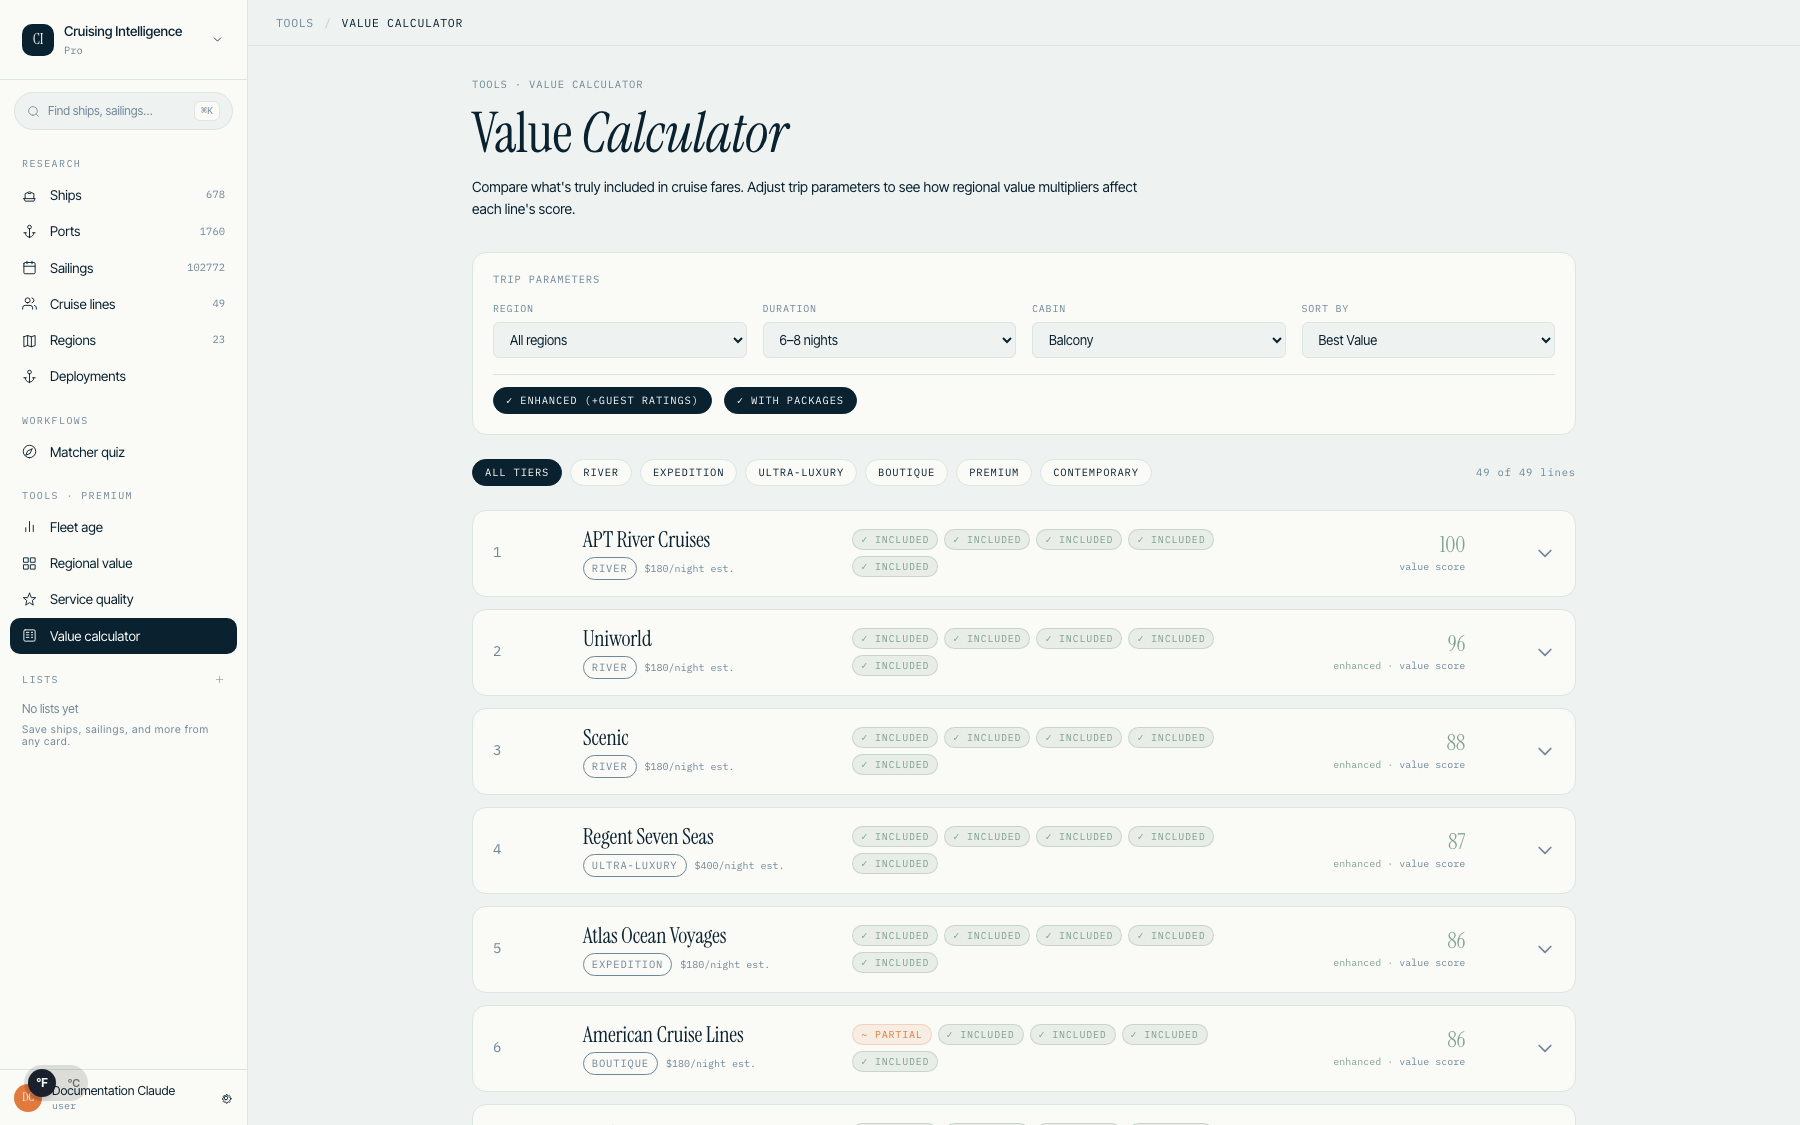
Value Calculator
Score the true value of a cruise by selecting inclusions: beverages, gratuities, WiFi, specialty dining, and excursions. The trip controls let you set region, duration, occupancy, and cabin type. A live effective-PPPD (price per person per day) updates as you toggle inclusions. A disclosure strip reminds you: "Estimate only. Pull live fares at quote time."
11.AI Chat Assistant
Your AI-powered research assistant is available on every page via the Jarvis Pill in the bottom-right corner. Ask natural language questions about ships, cruise lines, itineraries, ports, and more.
Opening the Chat
Click the pill-shaped button in the bottom-right corner of any page. The pill expands into a 380px-wide panel with your conversation history and a text input.
Query Categories
The assistant supports 35+ tools across six categories:
- •Ship Intelligence — "Tell me about Icon of the Seas", "Compare Celebrity Edge vs Wonder of the Seas"
- •Cruise Line Comparison — "What is included with Viking cruises?", "Compare Royal Caribbean and Norwegian"
- •Demographics & Targeting — "Which cruise lines are best for families?", "Budget-friendly lines for first-timers"
- •Itineraries & Sailings — "Mediterranean cruises in July 2026", "What ships sail to Alaska?"
- •Port Intelligence — "How busy is Barcelona in August?", "Best time to visit Santorini"
- •Destination Intelligence — "What are the risks of Eastern Caribbean?", "Which ships are best for Mediterranean?"
How It Works
The AI Chat uses a two-call pipeline: a fast router determines which tools to invoke, then a synthesis call generates the final answer. Most queries cost approximately $0.03. The tri-stage blended pipeline averages ~$0.007 per query.
Query Limits
- •Trial: 10 AI queries total during your 14-day trial
- •Basic plan: 300 queries per month
- •Premium plan: unlimited queries per month
AI Chat can query the FalkorDB knowledge graph directly for destination and persona questions. Ask "Which destinations are best for couples?" and it will traverse the graph without needing a live LLM call for the lookup.
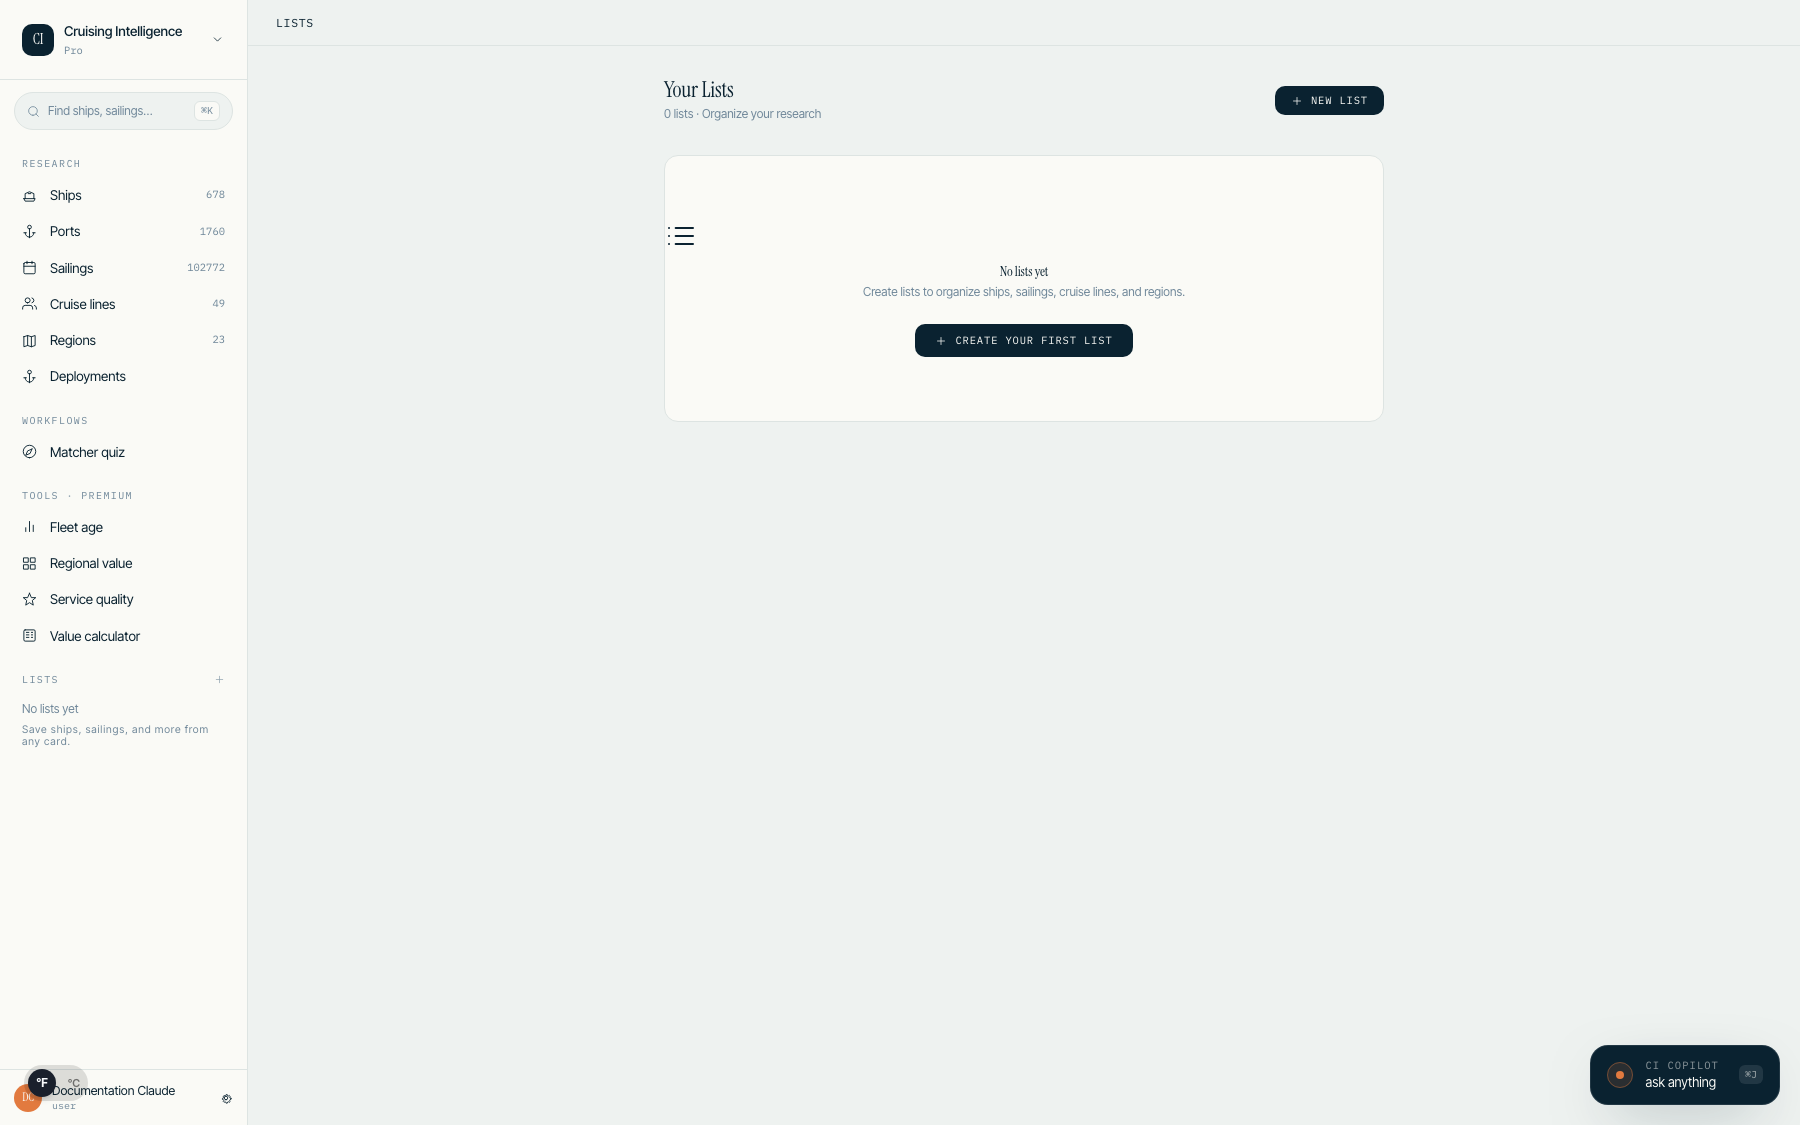
12.User Lists
Create and manage lists of ships, sailings, and cruise lines to organize your research per client or trip.
Creating a List
From any research surface, click the list icon on a card to add it to an existing list or create a new one. Lists support mixed entity types — ships and sailings can live in the same list.
List Detail Page
Each list has a detail page showing all items with their key stats, plus a notes field for client-specific context. Click any item to jump to its detail page.
Dashboard Integration
Pin your most-used lists to the dashboard for one-click access. Pinned lists show the item count and last-updated timestamp.
13.Settings & Preferences
Units Toggle
Switch between Imperial and Metric units using the toggle in the bottom-left corner of the app shell. Affects temperature, ship measurements, wave height, and wind speed. Your preference is saved automatically.
Theme
Cruising Intelligence uses a single light theme in Harbor mode. The legacy dark mode toggle is not shown when Harbor UI is active, ensuring a consistent experience across all surfaces.
Advisor Profile
Complete your advisor profile in Settings so the itinerary export PDF renders your contact card correctly. Include your name, agency, email, and phone number.
14.Subscription Plans
After your 14-day trial, choose the plan that fits your workflow:
| Feature | Basic | Premium |
|---|---|---|
| Price | $20/month | $30/month |
| All platform tools | Included | Included |
| Ship Browser, Sailings, Matcher | Included | Included |
| Comparison & Analytics Tools | Included | Included |
| AI Chat Queries | 100/month | 300/month |
| Metered Overage | $0.05/query | — |
15.Tips & Best Practices
For Client Consultations
- •Use the Cruise Matcher with clients on a call — walk through the quiz together
- •Export itineraries as PDF to email with route maps and port conditions
- •Check port detail pages before recommending a sailing — weather and crowding matter
- •Use persona badges on ship and cruise line pages to surface pre-computed insights instantly
For Research
- •AI Chat is your fastest tool — ask complex questions instead of navigating multiple pages
- •The Deployment Grid shows seasonal patterns that are hard to spot in list views
- •Fleet Age Tracker helps identify lines investing in new ships vs. aging fleets
- •Service Quality ratios reliably indicate onboard experience quality
For Sales
- •Regional Value shows which lines offer the most included value per destination
- •Ship detail pages give you talking points (unique features, world firsts)
- •The Value Calculator builds confidence — data-backed recommendations close more sales
- •Save matcher results as lists so you can revisit recommendations without re-taking the quiz
Need Help?
Our support team is here to help you get the most out of Cruising Intelligence.
support@cruisingintelligence.com