Objective data for subjective conversations.
Crew-to-guest ratios, composite service scores, and tier-by-tier comparisons across six categories. The numbers behind the "service" promise.
Start 14-day trial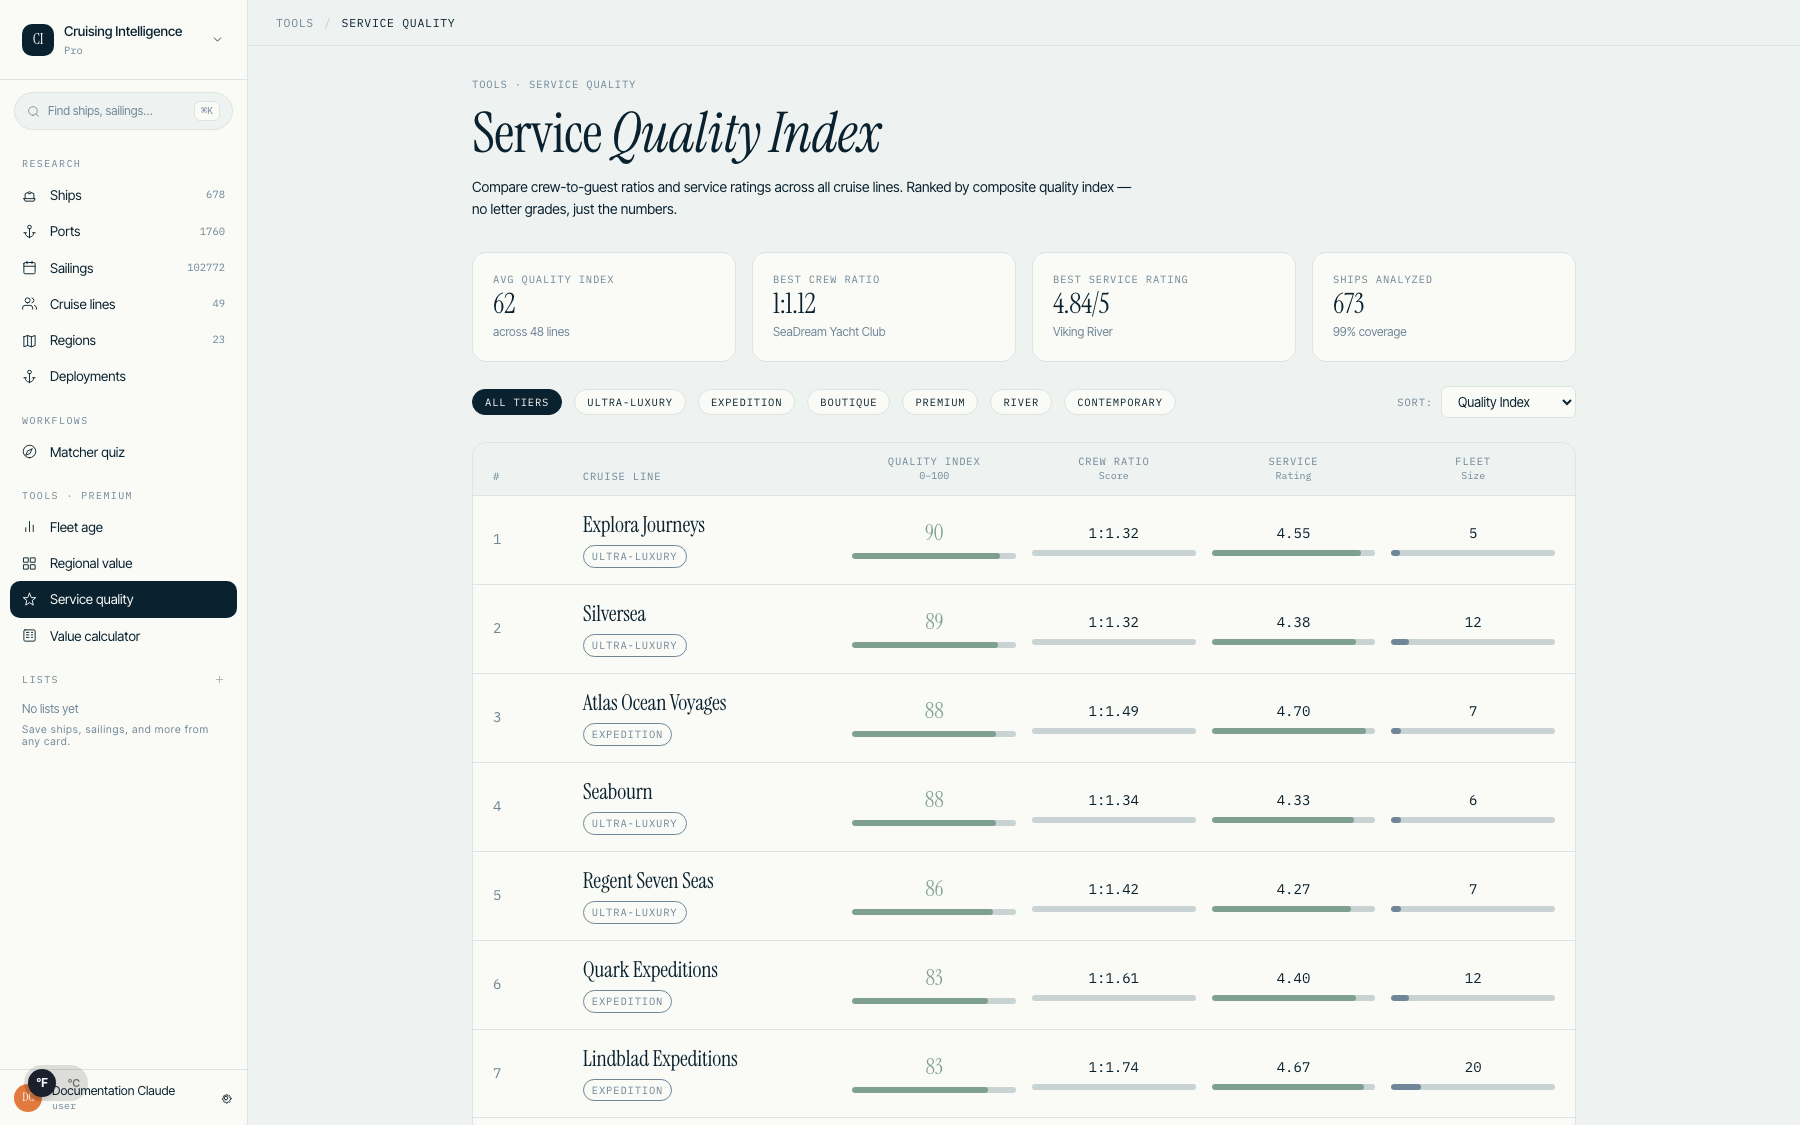
What service quality actually means.
Every cruise line promises "exceptional service." The Service Quality Index measures what that promise actually costs them - starting with the crew-to-guest ratio, the single most predictive metric for onboard service quality.
Ultra-luxury lines average 1 crew member for every 1.3 guests. Contemporary lines run closer to 1:2.6. That gap shows up in everything from dining room attentiveness to cabin turnaround speed to poolside drink delivery. The ratio is not the whole story, but it is the foundation.
On top of ratios, the index blends composite service ratings from expert assessments and verified guest reviews across six dimensions: overall service, dining service, cabin service, spa service, entertainment quality, and excursion coordination. Each line gets a scorecard you can share with clients who want to see the data.