Deployment Grid: Who Sails Where, Every Season
"Who sails to Alaska in 2027?" Used to be a research project. Now it's one click. Inside the seasonal coverage map.
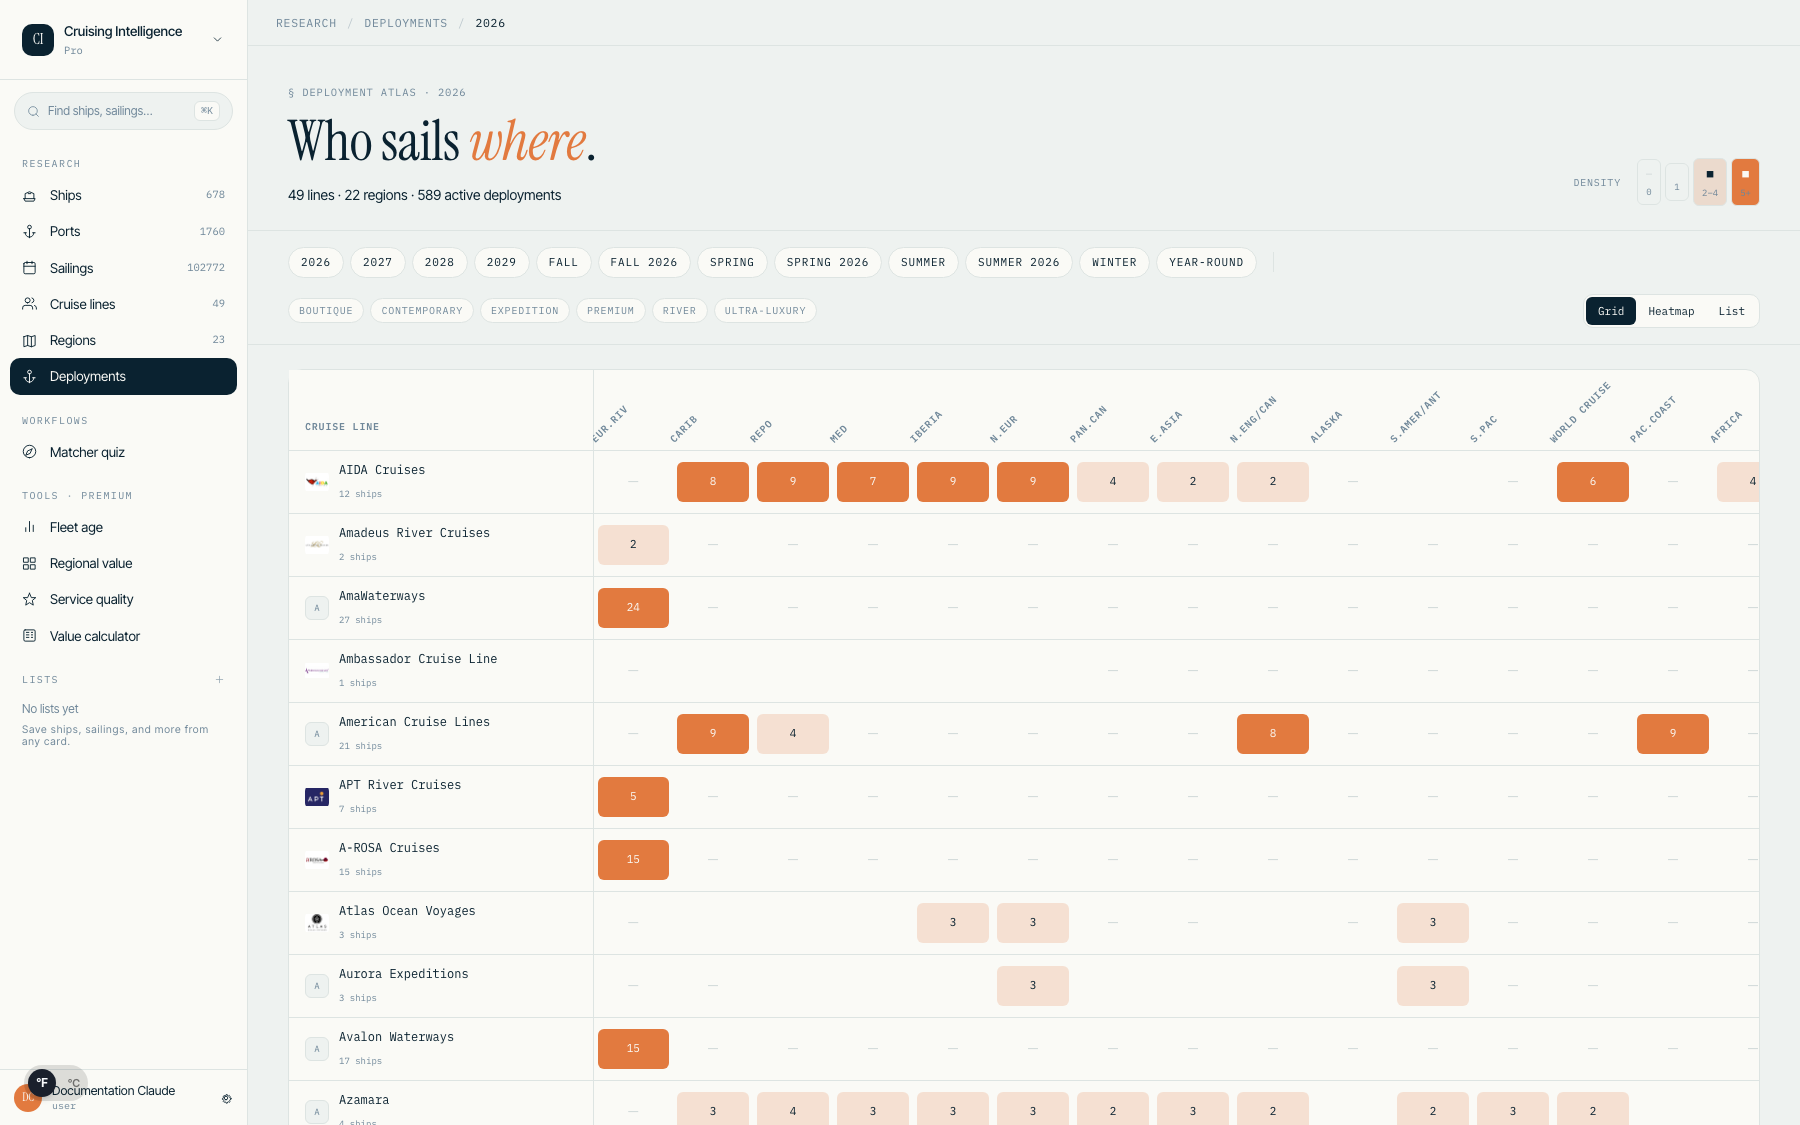
The question that used to take an afternoon
"Who sails to Alaska in 2027?"
Answering that meant press releases, deck-plan PDFs, and booking systems that were never designed for research. Deployment data is scattered everywhere and consolidated nowhere.
The Deployment Grid consolidates it into a single view: cruise lines on one axis, regions on the other, with season as the filter. One click answers the question.
How it works
Click any cell to see the exact ships deployed. Click a region total to see every line that sails there. Filter by season (Summer 2026, Winter 2027) and by tier (Contemporary, Premium, Ultra-Luxury) to narrow the field.
A month-by-region calendar view shows scheduled sailings across every line — useful for spotting shoulder-season gaps or identifying which lines commit the most capacity to a region.
How advisors actually use it
Gap analysis — find regions with only one or two lines. Those are niche opportunities for clients seeking something uncommon.
Season planning — see which lines shift ships between the Caribbean (winter) and the Mediterranean (summer), and time your recommendations accordingly.
Tier comparison — filter to Premium or Ultra-Luxury to see concentrated deployment in regions like Antarctica or the Galápagos.
Ship-level detail — click any cell to open a modal with the exact ships, home ports, and deployment dates.
The value
Deployment data is the answer to "who, where, when." When you can answer it instantly, you stop being the person who says "let me check" and start being the person who already knows.
See who sails where on your 14-day free trial. No card required.